 Solar and wind energy have been underestimated by analysts and politicians again and again and again. They have gotten cheaper and scaled up faster than even the most optimistic forecasts of a decade ago, or even a few years ago.
VOX — And there’s good evidence we’re still underestimating them. In fact, two new reports — one on solar, one on wind — make the point vividly. They argue that the radical trends of the last decade are going to continue, which is all that needs to happen for the energy system to tip over from disruption into revolution. Solar is going to play a much bigger role than most models predict So far, official predictions have fallen woefully short of the rise of solar photovoltaic (PV) energy: That red line is installed PV capacity. The black lines are forecasts from the International Energy Agency (IEA), blue from the German Advisory Council on Global Change, and green from Greenpeace. Only Greenpeace’s projections have come close, and only recently. The graph is from a new commentary in the journal Nature Energy, by researchers from Germany’s Mercator Research Institute. In it, they review the reasons why models have traditionally underestimated PV and then try running a popular model updated with better information. The results are instructive, to say the least — if they are right, PV could potentially provide fully half of global electricity by 2050. In most models that show the world reducing emissions enough to hit the 2°C climate target, “solar energy emerges only as a minor mitigation option” — around 5 to 17 percent of global electricity supply in one representative study used by the Intergovernmental Panel on Climate Change (IPCC). Models tend to be much more bullish on energy from biomass, despite its much lower total potential. Why are models still so tepid on PV, despite its record? What are they missing? The researchers hone in on three phenomena that most models fail to properly account for: Policy support: For the most part, models can’t or don’t take into account the kinds of tech-specific, country- or state-level policies that have been crucial to PV’s growth — especially feed-in tariffs (which guarantee homeowners a fixed 20-year return on PV investments) implemented early on in Germany, Spain, Italy, and China. The US used the investment tax credits and net metering. Other countries have other tools, but almost every country has some kind of support for PV. That support has dramatically accelerated its growth and innovation. Rapid learning: The costs for solar PV modules “have decreased by 22.5% with each doubling of installed capacity,” which is a considerably more rapid learning rate than your average tech. (It’s a “steep learning curve,” in the jargon.) Faster capacity growth than expected + faster technological learning than expected = lower prices than expected. Cost increases of competing clean energy sources: Models tend to be wildly optimistic on nuclear power and carbon capture and sequestration (CCS), despite the fact that, unlike PV, those technologies fall short of model projections again and again. The more decarbonization work that models assign to them, the less is left over for PV. Put more bluntly: Models stubbornly keep favoring nuclear and CCS over PV; the real world stubbornly keeps favoring PV over nuclear and CCS. There is every reason to think all three of these phenomena will continue to be true in coming years. (The report contains a short but fascinating discussion of all the many technological developments on PV’s horizon — still tons of room to improve.) The researchers see two key challenges ahead, if PV is to continue its rapid expansion. The first is the cost of financing, especially in the developing world. The second is integrating high levels of wind and solar into the grid. (Because wind and solar are variable, they require sophisticated balancing from other sources and grid technologies; I wrote about that challenge in some detail here.) Say PV can address those challenges and maintain its current rate of learning, improvement, and expansion. What would a more realistic model projection look like? To find out, the researchers plugged better cost information and more aggressive cost-curve assumptions into REMIND, a “global inter-temporally optimizing energy–economy model that has been extensively used for analyses of climate policies.” The gray shaded areas show the potential growth of PV, bounded by the lowest and highest historical growth rates. As you can see, this updated model run shows PV wildly outperforming most other model runs (the areas in other colors), eventually providing 30 to 50 percent of global electricity. Now, there’s no guarantee that PV will continue growing at historical rates. In fact, there are reasons to think wind and solar will run into serious problems as they expand (see this postfrom Jesse Jenkins and Alex Trembath). But even the bottom end of this new forecast (30 percent of global electricity) is a hell of a lot higher than the high end (e.g., 17 percent) on the forecasts the IPCC and the IEA are using. If PV can maintain anything even close to its recent explosive growth, it is going to outperform what analysts expect. Again. Wind costs could drop another 50% and beat natural gas without subsidies, say nerds The second bit of happy news comes from researchers at Atmosphere to Electrons, an R&D program for wind power at the National Renewable Energy Laboratory (NREL). Their new paper is primarily about the scientific and technical challenges their team is researching — high-tech ways to further improve wind turbines and farms. But as part of the exercise, they project just how much wind costs could fall if all those high-tech solutions are implemented. It’s pretty mind-blowing. The researchers are pursuing what they call “System Management of Atmospheric Resource through Technology” (SMART) strategies — a cluster of technologies and practices that will allow next-generation wind farms to produce more energy, more reliably, for more hours of the day. Here are the four areas of innovation they are going after, translated into English: Better predicting performance through high-fidelity physics modeling (HFM) of local conditions. Better design and control at the plant level by using sensors and real-time monitoring of wind flows as they move through the turbines. Better design and control at the turbine level through “innovative rotor and drivetrain technology” and scale (i.e., taller towers and bigger blades). Smarter grid integration by giving each turbine the ability to communicate directly with the grid, play a role in its “stability and operational planning,” and offer it various extra services like voltage regulation (don’t ask). Just how much of a difference would these changes make? To find out, the researchers ran a simulation of a 2030 wind-power plant using all the SMART innovations, operating at a site with roughly average wind resources. The result: unsubsidized energy costs ranging from $19 to $32 per megawatt-hour, with an average of around $23/MWh. That is roughly 50 percent lower than today’s wind power costs. So after dropping 65 percent between 2009 and today, wind-power costs could drop another 50 percent by 2030. That’s pretty amazing. Energy costs of $23/MWh would make wind competitive with natural gas almost everywhere in America, without subsidies. Of course, this rosy forecast is somewhat predicated on the DOE continuing to fund this kind of research, which is by no means a sure thing these days. But as John Hensley of the American Wind Energy Association (AWEA) writes, plenty of other analysts are similarly bullish. A survey of wind energy experts last year by Lawrence Berkeley Lab found that they too expected substantial cost drops (though 40 percent by 2030 was their high end). Like solar, wind still has tons of room to improve. Today’s status quo leads to revolution It’s a little odd. Both of these reports offer forecasts that are wildly optimistic relative to the mainstream modeling community, but it’s not because they predict wind and solar are going to have some unprecedented explosion. They simply predict that wind and solar are going to keep doing what they’re doing — keep scaling up, keep improving, keep getting cheaper — at roughly the same rate they have been. If that happens, solar PV could provide 30 to 50 percent of global power. If that happens, wind power could be 50 percent cheaper by 2030. If those things happen, if the status quo continues, it will amount to a renewable energy revolution. As I said, there are reasons to think wind and solar will start running into technical and financial challenges as their share of grid power rises. How much those challenges will slow them down is difficult to predict, but they’ll probably slow them down some. Getting to 50 percent wind and solar on a grid would be heroic; getting beyond that will require radical technological, political, and legal changes that go far beyond just wind and solar power plants themselves. My own sense of things is somewhat gloomier than these reports suggest. But wind and solar have been defying gloomy predictions for well over a decade now, so maybe they’ll keep doing so. As stockbrokers like to say, past performance is no guarantee of future results. There’s no guarantee wind and solar will stay on their current path. But at the very least, it seems like modelers should take continuation of status quo trends as their baseline, their reference case, instead of assuming, over and over, and that wind and solar growth will slow (and being proven wrong, over and over). It may seem crazy to say in this day and age, but sometimes a little optimism is warranted.
0 Comments
 FUTURISM — Between July 2016 and July 2017, Australia generated enough energy from renewable sources to provide electricity to 7.1 million homes, roughly 70 percent of the country’s total households, according to a newly released report produced by Green Energy Markets The Australian Renewable Energy Index is a country-wide report that analyzes the impact of renewables on the nation’s overall electricity and energy landscape. August marked the first time the report was released, but the plan is to publish one every month moving forward. This month’s report provides a clear indication of how far Australia has come in its efforts to bolster renewable and clean energy, as well as how much further it could go. “The renewable energy sector has staged a remarkable recovery, after investment completely dried-up under former prime minister Tony Abbott,” Tristan Edis, an analyst from Green Energy Markets, told The Guardian. He added that the report confirms how renewables could become a “significant source of power” for the country and help the economy by producing “construction jobs and investment boom.” A WORKING ALTERNATIVE Despite still leaning heavily on coal- and gas-fired power plants for electricity, Australia has stepped up its renewable energy game. The report notes that renewables made up some 17.2 percent of electricity used countrywide during the July 2016 to July 2017 period. That’s a huge leap up from the 7 percent output a decade ago. Hydro-electricity accounted for 40 percent of this renewable power, while wind was the second largest source at 31 percent. Considering the continent is often bathed in sunlight, the fact that about 20 percent of Australia’s renewable energy comes from solar power is likely unsurprising. According to the report, roughly 150,000 small-scale solar systems were installed on rooftops this year. They produced enough energy to supply electricity to more than 226,000 homes, and their installation supported some 3,769 full-time jobs. Speaking of jobs, the country currently has 46 large-scale renewable energy projects under construction, supplying full-time jobs that could employ 8,868 people for a year. When those renewable energy projects are finished, Australia is expected to be able to produce enough energy to power 90 percent of the nation’s homes. Of course, the impact these renewables have on the environment is perhaps even more than notable than their benefit to the economy. During the said financial period, Australia’s renewable energy systems slashed a total of 24.5 million tonnes (27 million tons) of carbon dioxide emissions — that’s equivalent to removing 8.1 million cars from the roads. Based on the finding of this report, Australia is on pace to meet its renewable energy target — 20 percent of total generation by 2020 — by the end of 2018, making the nation a sterling example for others to follow. 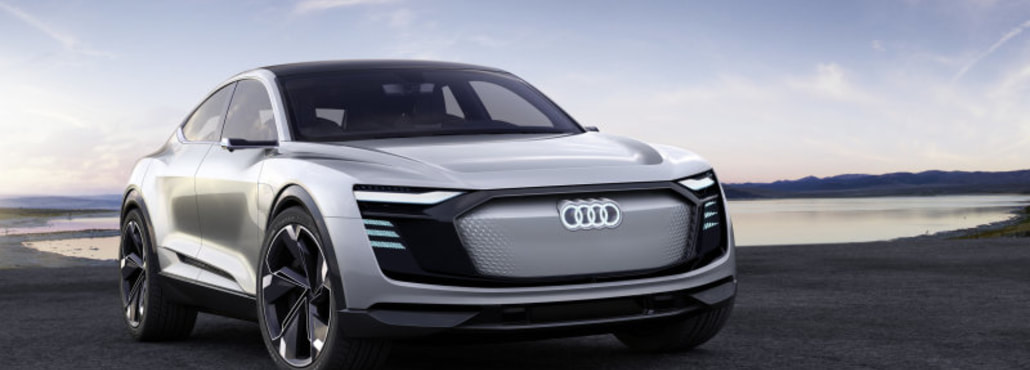 FUTURISM — We may be a long way away from solar powered electric vehicles the likes of which Lightyear is trying to build, yet some larger car companies are starting to toy with the technology in some novel ways. The German luxury car manufacturer Audi is partnering with Chinese solar company Hanergy to integrate solar cells into future vehicles, hoping to embed their solar cells in upcoming panoramic roofs.
Right now, the plan is not for the cells to supply power directly to the vehicle’s battery, but rather to serve as a power source for the car’s air conditioning system. This will give the car more range as the a/c system will not also be drawing from the battery. The Prius has a similar system in its Prius Prime model. According to Fred Lambert of Electrek, “we estimated that the solar cells on the Prius Prime’s roof could generate enough power to add about ~2 miles of range during the day. And of course, that’s highly dependent on where you are in the world and where you park your car.” Audi will likely continue to develop this technology as solar power generation becomes more technically sophisticated and efficient. We could see the first prototype Audi roofs completed as soon as the end of the year. INVESTMENT BANK REPORT PREDICTS THE COST OF ELECTRIC VEHICLES WILL MATCH REGULAR CARS BY 20188/29/2017  FUTURISM — The cost of making EVs could become cheaper too, which can increase profit for car makers.
DRIVING DOWN THE PRICE Over the past couple of years, we’ve seen a surge in electric vehicle development. Apart from Tesla, there are now over a dozen other startups working on their own electric car concept. Even veteran car makers have jumped on EV trend: Swedish car manufacturer Volvo ditching petrol-fueled cars starting in 2019, and luxury car maker Porsche has promised that half of its new vehicles will be electric by 2023. Undoubtedly, EVs are starting to take over the automobile market. International investment bank UBS thinks the first step in market dominance of EVs would be in terms of costs. In a report published on May, analysts from the bank’s “evidence lab” predicted that EV prices will soon match those of combustion-engine cars. According to The Telegraph, the UBS report predicts that the “total cost of consumer [EV] ownership can reach parity with combustion engines from 2018”, a trend which would likely begin in Europe. “This will create an inflection point for demand. We raise our 2025 forecast for EV sales by 50% to 14.2 million — 14% of global car sales.” UBS reached this conclusion after tinkering with a Chevrolet Bolt EV, which it described as “the world’s first mass-market EV, with a range of more than 200 miles.” COMPETITIVE ADVANTAGE The UBS prediction somewhat matches a report by Dutch bank ING, which expects electric cars to dominate European roads by 2035. Indeed, both said that a major factor would be a decrease in costs; a trend that’s already begun. With newer models coming out, the price of older EVs has dropped, with some even getting discounts of up to $20,000. Speaking of new vehicles, the recently launched Tesla Model 3 is expected to boost mass adoption of EVs with its relatively affordable price. While it’s currently the cheapest EV out there, Nissan’s 2018 Leaf promises to cost some $5,000 less than the Model 3. This doesn’t mean, however, that electric cars aren’t going to be profitable. “Once total cost of ownership parity is reached, mass-brand EVs should also turn profitable,” the report said. The UBS report also noted that manufacturing EVs is cheaper than they previously thought — and there’s still more room for cost reduction through strategies like developing cheaper batteries and building more charging infrastructure. These measures will be important, since more and more countries are now opting for EVs. France will ban selling petrol and diesel cars by 2040, while all cars sold in India will be electric by 2030. Electric cars aren’t the only clean energy tech that’s been getting less costly. Renewable energy sources, like solar and wind, continue to be cheaper than their fossil fuel counterparts. The price of solar panels has, for example, dropped over the last few months. The decreasing cost of EVs seems to be part of a greater revolution towards clean energy.  CLEANTECHNICA — In fact, they contend that the changeover would actually spur job growth while dramatically reducing carbon emissions.
Charting the Pathway to 100% Renewable Energy The new report is an outgrowth of a similar project from 2015 that laid out the steps all 50 states in the US would need to take in order to transition to 100% renewable energy. Why 139 countries? Because that group is responsible for 99% of all global carbon emissions. The report was published August 23 by Joule, an online resource that focuses on news about renewable energy. Changing conventional wisdom is hard, but it can be done. People laughed at the Wright Brothers and their silly idea that we could fly from place to place. Today, there are more than 100,000 commercial airline flights a day worldwide. Television? Forget it. Smartphones with more computing power than an Apollo mission? Will never happen. Change happens very slowly, but when it gets started, it builds momentum with amazing speed. Jacobson’s group developed roadmaps that assess the renewable energy resources available to each country; the number of wind, water, and solar energy generators needed to get to 80% renewable energy by 2030 and 100% by 2050; how much land and how many rooftops these power sources would require; and how the proposals for each country would reduce energy demand and cost when compared to a business-as-usual scenario. “Both individuals and governments can lead this change. Policymakers don’t usually want to commit to doing something unless there’s some reasonable science that can show it’s possible and that’s what we’re trying to do,” says Jacobson, who is also a member of the board for the Solutions Project, a US-based nonprofit that works to educate the public and policymakers about a transition to 100% clean, renewable energy. “There are other scenarios. We’re not saying there’s only one way we can do this, but having a scenario gives people direction.” By the way, due to the progressive and influential work Jacobson has been leading, he is in one camp with Elon Musk — he’s getting trolled by anti-renewable forces on the interwebs and in the flesh. Also see these two articles: Average daily global sunlight via Stanford University and Mark Jacobson The researchers examined several aspects of each country’s economy, including its electricity, transportation, heating/cooling, industrial, and agriculture/forestry/fishing sectors. Their analysis revealed that those countries with lots of available land will find the transition to renewable energy the easiest. Countries like Singapore, which has little open land and is surrounded by oceans, may need to look to offshore wind energy to meet its goals. Moving away from fossil fuels will bring with it ancillary benefits. For example, eliminating the use of oil, gas will cut about 13% from the world’s energy budget because mining, transporting, and refining those fuels are all energy-intensive activities. The greater efficiency of electric motors versus internal combustion engines could reduce global energy demand by another 23%. Some benefits are hard to quantify, but less international squabbling over access to fossil fuels will definitely be a plus for all concerned. The authors also suggest that making the transition from fossils fuels to renewables will result in a net gain of 24 million employment opportunities worldwide. “Aside from eliminating emissions and avoiding 1.5º C global warming and beginning the process of scrubbing carbon dioxide from Earth’s atmosphere, transitioning eliminates 4 to 7 million air pollution deaths each year and creates over 24 million long-term, full time jobs by these plans,” Jacobson says. “What’s different between this study and other studies that have proposed solutions is that we’re not just trying to examine the climate benefits of reducing carbon but also the air pollution benefits, jobs benefits, and cost benefits.” Responding To Critics Critics of the report point out that the recommendations ignore the potential of nuclear power, as well as so-called clean coal and biofuels. The authors respond that nuclear plants take 15 to 20 years to design and build and bring with them “robust evidence” of a risk of weapons proliferation risk, meltdown risk, and waste management risks, according to the Intergovernmental Panel on Climate Change. Clean coal has been condemned recently as a myth, and the production of biofuels creates 50 times as much carbon pollution as renewables, according to the report. Jacobson and his colleagues highlight the inherent efficiency advantage of electric motors compared to internal combustion engines as the foundation of their recommendations. By their calculations, ICEs are less then 7% efficient by the time the costs of finding and extracting fossil fuels, transporting them, distributing them, and burning them are totaled and compared to the total amount of work produced. They go on to advocate for underground heat storage for homes and businesses, pointing to Denmark, where such technology is common. They also presume that electric airplanes will become commonplace in the future as more and more companies invest in that technology. How much is all this going to cost? Trillions. But Jacobson and his colleagues say keeping the existing fossil-based economy will cost 4 times as much, particularly when the economic value of better health and longer lifetimes is factored in. Over time, those benefits will more than equal the initial investment needed to go 100% renewable. In the final analysis, how do you put a price on preserving a world that is fit for human habitation? In a preview of the report, Mark Dyson of the Rocky Mountain Institute writes, “This paper helps push forward a conversation within and between the scientific, policy, and business communities about how to envision and plan for a decarbonized economy. The scientific community’s growing body of work on global low carbon energy transition pathways provides robust evidence that such a transition can be accomplished, and a growing understanding of the specific levers that need to be pulled to do so. Jacobson et al.’s present study provides sharper focus on one scenario, and refines a set of priorities for near-term action to enable it.” In other words, an actual plan as opposed to political rhetoric or dogma. Combined with the suggestions made by the authors of the new book Drawdown, the Jacobson report marks the end of hand wringing and the beginning of actual strategies to address the most serious existential threat humanity has faced since The Flood. 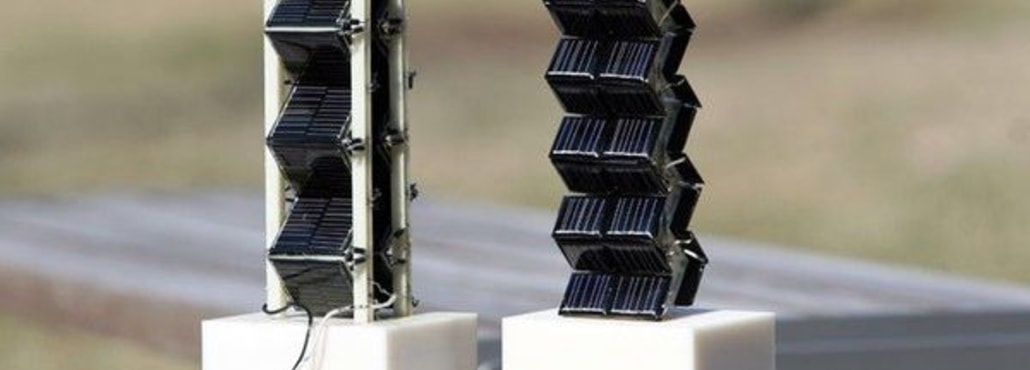 TREEHUGGER — The 3D designs can generate anywhere from double up to 20 times the amount of energy as flat solar panels with the same base area.
These 3D designs increase electricity output because their vertical surfaces allow them to capture sunlight even when the sun is closest to the horizon during mornings, evenings and winter and when sunlight is partially obstructed by shadows or cloud cover. The researchers ran computer algorithms to come up with the best 3D designs and theoretically tested them in a range of latitudes, seasons and weather using analytical software. The researchers then built three different models -- two different cubes and a tower setup -- and tested them on the roof of the laboratory for a few weeks to get the results The advantages to these 3D designs are both the increased power output and a more uniform and predictable power output, which means that solar power can be better integrated into power grids. While these designs will be more expensive to manufacture, the increase in performance will offset the cost of building them. The researchers are now focusing on the tower design since it could easily be shipped flat and then popped up during installation. Their next step is to test multiple towers together to see how shadows from other towers as the sun moves across the sky during the day affect the modules' performance. Once the ideal arrangement of these towers is determined, the researchers see a future where these new designs are used on both rooftops and in large solar farms.  GREENTECH MEDIA — The global solar market has been downgraded for 2017. A worrying sign? Hardly.
Even with a 4-gigawatt downward adjustment in projected installations, it's still going to be a record-breaking year for new solar capacity additions -- yet again. The 81 gigawatts expected this year are more than double the amount of solar capacity installed in 2014. And it's 32 times more solar deployed a decade ago. (In the year 2000, global installations totaled 150 megawatts.) Those numbers come from GTM Research's latest edition of the Global Solar Demand Monitor, which closely tracks market-moving and market-dooming developments in countries around the world. One of the most telling statistics: By 2022, global capacity will likely reach 871 gigawatts. That's about 43 gigawatts more than expected cumulative wind installs by that date. And it's more than double today's nuclear capacity. In fact, by the end of 2017, solar PV could rival global nuclear capacity. That's a major milestone. According to the Nuclear Energy Institute, there are 391.5 gigawatts of nuclear plants operating around the world. When the year closes out, there will be roughly 390 gigawatts of solar PV plants spread across the globe, according to estimates from GTM Research. (The final numbers could be larger, since the outlook for China is growing stronger.) For the first time ever, solar power plants and nuclear power plants will be on equal footing -- at least when it comes to raw capacity. Of course, capacity only tells us part of the story. It's all about electrons. And in that regard, nuclear still dominates. Nuclear generates 2,476,671 gigawatt-hours of electricity every year, accounting for roughly 11 percent of global generation. Solar, on the other hand, only accounts for 375,000 gigawatt-hours of electricity yearly, or about 1.8 percent of global generation The generation gap is significant. But a crossover is approaching. In 2014, the International Energy Agency looked at PV growth rates through the middle of the century. Under a high-growth scenario -- which basically mirrors the current real-world scenario -- IEA found that the world could get 16 percent of its electricity from PV by 2050, and another 11 percent from concentrating solar power. That would make solar the dominant energy source globally. In the last three years, growth rates and cost reductions for solar have far exceeded projections. Meanwhile, high costs, slow construction and competitive renewable alternatives are causing the global nuclear industry to falter. The trend lines are becoming clearer every year.  IFL SCIENCE! —This isn’t just untrue, but it’s the exact opposite of what really happens when nations invest in solar and wind power. Even a modest expansion of both by 2050 would result in a net saving of $12.5 trillion to the global economy.
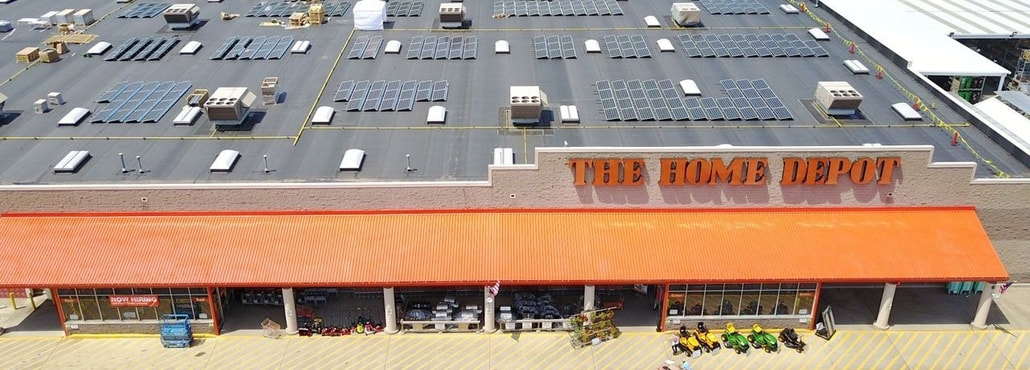 FOX BUSINESS — Home Depot will install solar panels on the rooftops of 50 stores in a partnership with General Electric and Tesla.
The home-improvement retailer said the project will cut each store’s use of the electric grid by 30% to 35% annually—the equivalent of powering 2,300 U.S. homes. The average Home Depot store roof is 104,000 square feet and can accommodate 1,000 solar panels. Construction of the mini solar farms will continue throughout 2017. Home Depot is working with GE subsidiary Current, a power management company, on 20 solar installations in New Jersey and eight in Connecticut, Maryland and Washington, D.C. The other 22 locations are located in California and New York, and eight of those stores will use Tesla Powerpacks to store energy. Home Depot, which employs more than 400,000 associates at 2,282 stores, said the new solar farms will lift the company’s alternative energy usage to more than 130 megawatts. It has set a goal of hitting 135 megawatts by 2020. Home Depot also operates two wind farms, leases roof space in Delaware and Maryland and uses fuel cells at more than 170 stores and distribution centers David Hawkins, Home Depot’s vice president of labor and operations, said alternative energy projects “reduce carbon emissions while also lowering our energy costs.” Amazon.com started a similar solar-power program earlier this year. The e-commerce giant will have solar panels atop 15 fulfillment centers by the end of 2017, and it expects to have 50 warehouses using solar power by 2020.  A combination of unfortunate topography, a large population, and the realities of worsening climate change makes California cities some of the worst places to breathe air in America.
QUARTZ — “No state has done more to address air pollution than California has done over the last 50 years. But they also have the biggest problems,” says Paul Billings, the senior vice president of advocacy at the American Lung Association, which issued its latest State of the Air report on Tuesday (April 19). Eight of the 10 cities with the highest year-round concentration of particulate matter—or PM2.5—between 2013 and 2015 were in California, according to the report. The state is also home to seven of the 10 American cities with the worst ozone pollution. Both PM2.5 and ozone are linked to a long list of health problems, including asthma, lung cancer, premature death, and developmental delays in children. Most polluted metropolitan regions by average year-round concentration of particulate matter (PM2.5)
Six of the top 10 cities with the biggest problem with unhealthy spikes in PM2.5 are in California, too. A “spike” is defined as a day when the concentration of PM2.5 rises above the limit set by the US Environmental Protection Agency for acceptably healthy air. Most polluted metropolitan areas by dangerous “spikes” in particulate matter (PM2.5)
Bakersfield, California remains the most polluted city in America in terms of spikes in particulate matter, with Visalia, Fresno, and Modesto-Merced coming in second, third, and fourth. All four cities are in California’s Central Valley, where PM2.5 is made abundant by the high volume of oil and gas drilling and diesel engines in the area. The Central Valley is also topographically cursed—it’s shaped like a bowl, so pollution is often trapped, unable to disperse, causing concentrations to rise to ever more unhealthy levels, according to Billings. Los Angeles, similarly, is stuck in a topographic bowl, which helped to land it at number one on a list of the most ozone-polluted cities in America (on that list, Bakersfield came in second). Most polluted cities by ozone pollution
Both Los Angeles and the Central Valley cities are prone to “ozone inversions” due to that topography, where warmer air floats above cooler air, forming a sort of atmospheric lid that keeps the air stagnant and prevents pollution from exiting the area. Agriculture, too, can contribute to ozone: the prevalence of certain pesticides containing volatile organic compounds, or VOCs, a precursor to ozone formation, pose another problem for the agriculture-rich Central Valley. Climate change is making all this worse—it means more severe periods of drought, and more hot, dry days mean more ozone formation. Climate change also creates prime conditions for more extreme wildfires, which produce both PM2.5 and the elements needed to form ozone. “Climate change is making air pollution worse, and harder to clean up,” says Billings. Despite all this glum news, air quality in America is improving on the whole. Although the American Lung Association found that 125 million people live in places with dangerous levels of air pollution, that’s still one-quarter fewer than in 2012-2014, the period analyzed by the Association’s prior report. That tracks with the consistent improvement in US air quality documented since the EPA began enforcing the Clean Air Act in the 1970s. But, Billings says, that could start to reverse if the current presidential administration makes its proposed cuts to the agency—and to the local departments it supports. “The cuts being proposed at the EPA will not only cripple the EPA’s enforcement of the Clean Air Act, it will also have a really negative impacts on local air pollution cleanup efforts—the president’s budget includes half a billion dollars in cuts to state and local grants. That’s money they use to clean the air,” Billings says. “Losing those dollars means that not only will the federal cop not be on the beat, it means that state and local agencies will be hamstrung as well. Which means we may lose some of the progress we saw in this report.” “And when there’s lack of enforcement we also know cheating occurs — you only have to look at Volkswagen.” |
James Ramos,BPII'm your go to solar energy expert here to guide you step-by-step through all of your solar options. Categories |
James The Solar Energy Expert
 RSS Feed
