 In the summer of 2010, Russia faced a severe drought, a heat wave and a series of catastrophic wildfires, destroying a third of the country’s wheat harvest. Half a year later, the Arab Spring began.
THE WASHINGTON POST — The two are connected: The Middle East and North Africa, among the most food-insecure regions in the world, rely heavily on grain imports from the Black Sea, especially Russia, one of the world’s largest wheat exporters. But the Russian government banned grain exports amid the dismal harvest, looking to protect its own food supply. Sapped of a major supplier, countries across the two regions saw bread prices skyrocket. And while many other factors fueled the political unrest characterized as the Arab Spring, the high cost of food fueled the broad popular discontent that prompted a string of attempts to overthrow illiberal regimes — some successful, some violently suppressed. The episode illustrated the fragile nature of the network the world uses to feed its approximately 7 billion people. Now a new report by Chatham House, a London-based think tank, details how climate change further threatens that network, as the type of extreme weather event that knocked out the Russian harvest becomes all the more common. Global food security depends on trade in just four crops: maize, wheat, rice and soybeans. The first three account for 60 percent of the world’s food energy intake. The fourth, soybeans, is the world’s largest source of animal protein feed, making up 65 percent of global protein feed supply. Their production is concentrated in a handful of exporting countries, including the United States, Brazil and the Black Sea region, from which they are flowing at ever-greater volumes. Between 2000 and 2015, global food trade grew by 127 percent to 2.2 billion metric tons — and growth rates are projected to keep increasing. But the movement of these crops hinges on just 14 “choke-point” junctures on transport routes through which exceptional volumes of trade pass. Such choke points have been perilously overlooked, said Rob Bailey, research director for energy, environment and resources at Chatham House and co-author of the report. Trouble ahead Imagine the following frightening-yet-plausible scenario: What if the next time Russia’s wheat harvest is devastated by drought, other major food producers are also facing struggles with severe weather and wrecked harvests? In the United States, that could mean a freak flood season that wipes out inland waterways or overwhelms coastal ports. Brazil, the world’s other heavy-hitter, accounts for 17 percent of global wheat, maize, rice and soybean exports. But its road network is crumbling. Extreme rainfall could knock out a major transport route. If this happened together with a U.S. flood and a Russian drought, there would be global food shortages, riots and political instability, starvation in areas that are heavily dependent on imports, and recessions everywhere else. The Panama Canal, linking Western and Asian markets, is one of the most critical maritime choke points: Thirty-six percent of U.S. maize exports and 49 percent of U.S. soybean exports pass through it each year. Another is the Turkish Straits, which connect Black Sea producers to global markets — including, critically, the Middle East. Seventy-seven percent of wheat exports from Russia, Ukraine, and Kazakhstan pass through these waters. Inland waterways, roads, and railways are critical too. Sixty percent of U.S. agricultural products make their way from farms to ports via the 12,000-mile Inland Marine Transportation System (IMTS), which comprises a network of rivers and tributaries. Similarly, 60 percent of Russian and Ukrainian wheat exports rely on the Black Sea rail network — a choke point that, along with its ports, the report calls the most volatile of the 14 choke points thanks to conflict with Crimea, diplomatic tensions over Syria and Yemen, and unstable trade relations with Europe. Disruption at any of these choke points would mean trouble, but if several jammed at once, it could be disastrous. Climate change makes such a scenario more likely. While it’s difficult to connect any specific weather event to climate change, models suggest the shifting climate is making such events more common. For the United States, the could mean a lot more episodes like the one in August 2012, when Hurricane Isaac closed ports and suspended barge traffic on parts of the Mississippi River. A frightening cycle Political instability can also cause choke point disruptions. In 2015 and 2016, tensions between Russia and Turkey fueled power plays in the Turkish Straits, and an attempted internal coup led to a temporary shutdown of the Bosporus. And disruption of key arteries due to political instability can lead to a self-reinforcing cycle, as food shortages breed further instability. In the Middle East and North Africa, statistical analyses show that food security is a particularly high indicator of political stability. Over a third of grain imports for the region pass through a maritime choke point for which there is no alternate route. But the problem is widespread. The 2007-2008 global food crisis was accompanied by protests in 61 countries and riots in 23. To make matters worse, chronic underinvestment in infrastructure has weakened critical networks. Extreme weather and increased trade flows put them at risk of failing. The McKinsey Global Institute places the world’s infrastructure investment deficit — the gap between funding available and funding needed — at $250 billion a year through 2040. (The United States has one of the largest deficits among G-20 countries, according to Chatham House.) But even where there is infrastructure investment, governments often fail to factor in climate risks: A 2016 survey by the Organization for Economic Cooperation and Development found that, with very few exceptions, they are largely overlooked even in rich countries. “It is a glide path to a perfect storm,” said Bailey. In fact, 13 of the 14 choke points have seen some form of temporary disruption or closure in the last 15 years, according to the report. (The only one that hasn’t, the Strait of Gibraltar, may now come under pressure in Brexit negotiations.) This should prompt policymakers to prepare for worst-case scenarios. But as Bailey observed, “We’re not very good at conceptualizing risks which we haven’t yet experienced.” The mentality is very different when it comes to the oil market, where past oil embargoes make the idea of a supply shock more tangible. “People obsess about choke points there,” he said. One solution is for countries to invest in individual emergency stores. But this risks creating an international "Hunger Games" — encouraging hoarding and scrambling behaviors in the event of a crisis and a death spiral of declining market confidence. “What is needed is a coordinated international approach like you have in energy markets,” Bailey said. In 1974, the International Energy Agency established emergency response mechanisms to minimize the risk of oil and gas disruptions. Governments and international responders, like the Food and Agriculture Organization of the United Nations and the U.N. World Food Program, should model this with rules on coordination during acute food disruptions. This would include emergency food supply sharing arrangements and smarter strategic storage — where choke points can’t cut off supply. But they also needed to take preventive measures, like diversifying production so countries aren’t dependent on a handful of mega-crops and exporters. Funding should support alternative sources and supply routes around the world, as well as climate-resilient infrastructure. But all of this requires long-term planning. It needs to start now — before extreme weather becomes even more frequent.
0 Comments
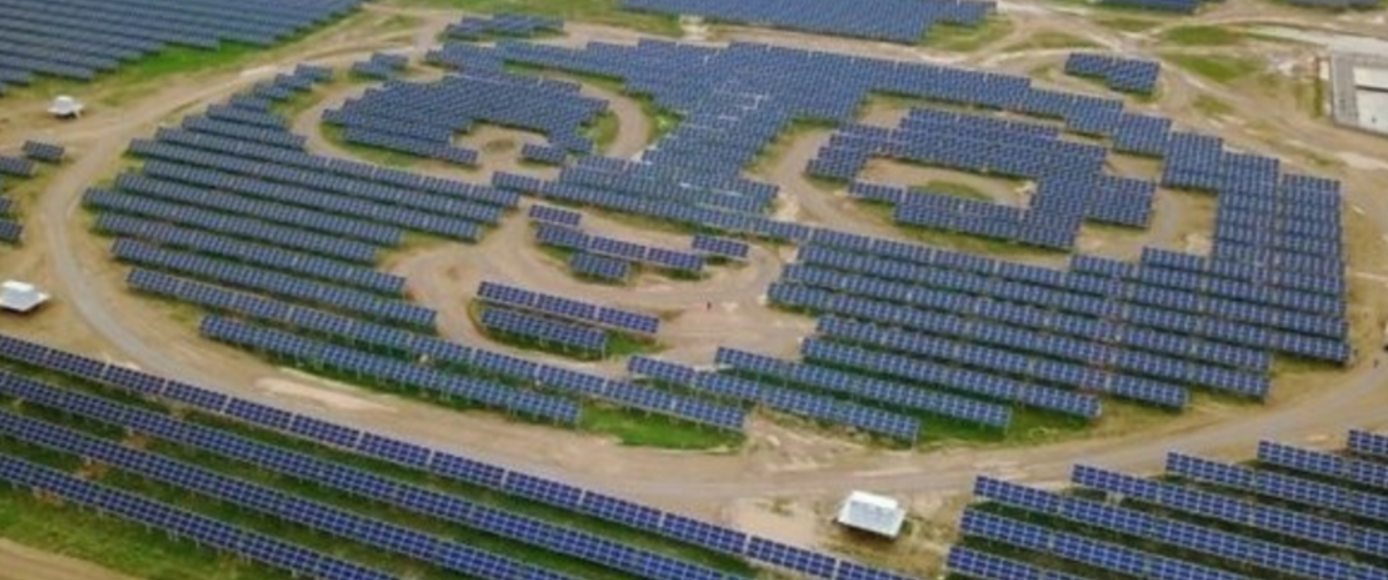 In a country where you can find everything from chopsticks to slippers designed to look like pandas, one Chinese energy company is going a step further by building 100 solar farms shaped like the bears along the route of the ambitious Belt and Road initiative.
REUTERS - Panda Green Energy Group (0686.HK) has already connected one such 50-megawatt (MW) plant to the grid in the northern province of Shanxi, the first step in a public relations stunt that emphasizes the cuddly side of the world's No.2 economy. Built with darker crystalline silicon and lighter-colored thin film solar cells, the plant resembles a cartoon giant panda from the air. "The plant required an investment of 350 million yuan ($52 million), and it would require investment of $3 billion for 100 such plants," Panda Green Energy's Chief Executive Li Yuan told Reuters. Li did not say where the longer-term investment would come from. The Hong Kong-based firm is currently in talks with Canada, Australia, Germany and Italy to launch more panda-shaped power stations. The Belt and Road initiative is a plan to emulate the ancient Silk Road by opening new trade corridors across the globe using roads, power lines, ports and energy pipelines. A 100-MW panda power plant would be expected to generate 3.2 billion kilowatt-hours (kWh) of energy over 25 years, according to the company, capable of supplying power to over 10,000 households annually. Panda Green Energy is currently constructing its second panda power plant in Shanxi, which accounts for a quarter of China's coal reserves. Utilization of one panda solar power plant will save the equivalent of a total 1.06 million tonnes of coal and cut emissions of greenhouse gases by 2.74 million tonnes in 25 years, the company said. The firm has been investing in and running solar power plants in China's major solar hubs such as Xinjiang and Qinghai province, as well as some solar projects in Britain. Shanxi aims to install 12 gigawatts of solar capacity by 2020 versus 1.13 GW installed in 2015. 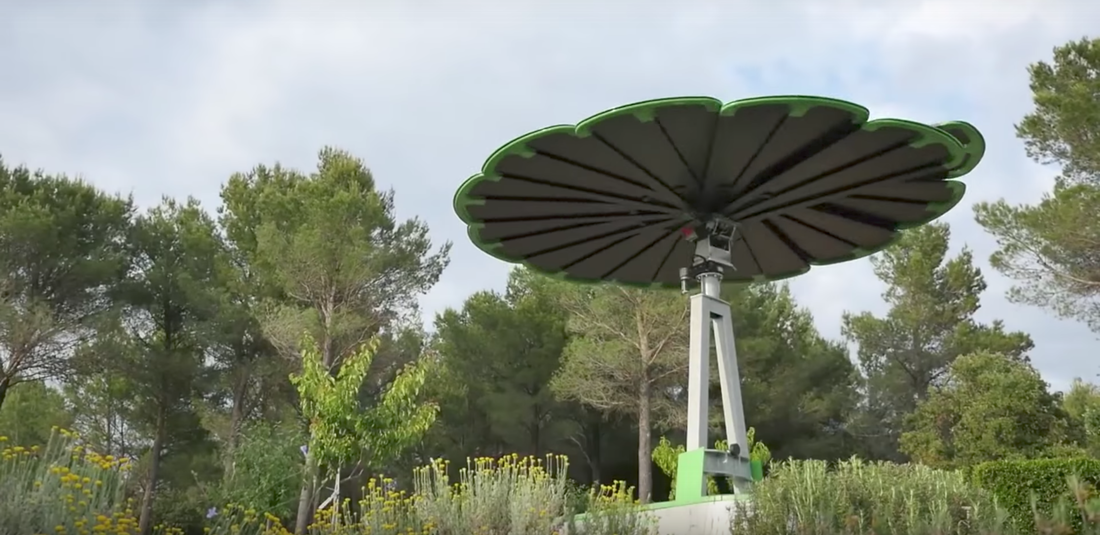 The kinetic design can produce 40 percent more energy than traditional solar.
CURBED — In the past six months, we’ve seen camouflage solar panels and new rooftop tiles from Tesla founder Elon Musk that look nothing like the dark, gridded rectangles of yore. But an Austrian-based company is looking to shake things up with the Smartflower, a solar system that aims to provide homes and businesses with plug-and-play power. Based off the concept of how a sunflower follows the sun, the Smartflower is a portable, adjustable petal system that tracks the sun’s path throughout the day. When the sun rises in the morning, the Smartflower automatically unfolds and begins producing energy by setting its petals at a ninety-degree angle. The flower goes “back to sleep” into a folding position at night or whenever high winds make it unsafe to operate. It does all of this autonomously through GPS-based dual axis tracking. It also boasts a cooling and cleaning system that brushes the back of each panel every time the unit folds and unfolds. Because the Smartflower is always at an optimal angle to the sun, it can generate 40 percent more energy production than traditional solar. The Smartflower is a kinetic all-in-one system, with the inverter, monitor, and batteries housed in the cabinet of the unit. This means that the solar system can be delivered, assembled, and installed in just a few hours. Even better, the Smartflower can be installed in any open space and you can draw power off of it just by plugging in. We wrote about the Smartflower in 2015 when it was in its design stages, but now there are two different models available for purchase (price varies depending on delivery and installation). The original Smartflower base model is a plug-and-play photovoltaic system meant for residential use that comes in eight different colors. The Smartflower is also electric vehicle-compatible thanks to easy integration with external EV charging stations. A larger model—the Smartflower Plus—offers an integrated battery storage system that lets you store solar energy for when you need it. The first Smartflower delivery to the United States is slated for mid-April, but approximately 1,000 units have been installed throughout Europe. Some are fueling homes while others have been installed in public places. A Smartflower powers an outdoor learning space at the Botanical Gardens in Madrid, Spain and the University of Applied Sciences Kufstein in Austria uses a Smartflower to power a cafe and provide walkway lighting.  Recent research suggests that certain technologies introduced over the past two centuries exhibit very predictable rates of advancement, becoming more efficient — and thus cheaper — at a steady clip. And solar energy is one of those technologies. Looking into the past can give us a glimpse of the future.
IEEFA.ORG — In 1965, Gordon Moore, one of the founders of chip giant Intel, noticed that the number of transistors per integrated circuit doubled every two years on average, with corresponding advances in speed and declines in cost. This quickly became known as Moore’s Law. In the succeeding half century, Moore’s Law has held up, with the cost of computing power plunging dramatically over the years. Last year, two economists named J. Doyne Farmer and Francois Lafond published an intriguing paper that riffed off Moore’s Law. “Many technologies,” they correctly observed, “followed a generalized version of Moore’s Law” in which “costs tend to drop exponentially.” Some technologies, however, do not follow this model, and it can be hard to distinguish between them. Past performance, in other words, is not always predictive of future results. In order to sort out the ones that follow a version of Moore’s Law from the ones that don’t, the researchers engaged in an interesting thought experiment. They selected 53 very different technologies across a range of sectors and built a deep database of historical unit costs for producing milk; sequencing DNA; making laser diodes, formaldehyde, acrylic fiber, transistors, and many other things; and electricity from nuclear, coal, and solar. They then engaged in a statistical method called “hindcasting.” This entails going back to various points in the past for each technology, taking whatever trend existed at the time, and then extrapolating it into the future. They then took this “prediction” and compared it to what actually happened. This has the virtue of actually testing the predictive power of the data rather than fitting the data to a model. Moreover, it gives some insights into the accuracy of future forecasts. After all, the authors note, a skeptic who looks at the trends in the cost of solar and coal “would rightfully respond, ‘How do we know that the historical trend will continue? Isn’t it possible that things will reverse, and over the next 20 years coal will drop dramatically in price and solar will go back up?’” Hindcasting offers a way to answer that question in quantitative terms. And the answers are rather interesting. The researchers found that many technologies don’t follow a robust version of Moore’s Law, even if the cost per unit can fluctuate a great deal in the short term. The cost of chemicals, household goods, and many other goods don’t stay the same, but they fluctuate in a random fashion, going up for a number of years and then going back down again. Others, like transistors, DNA sequencing, and others, are eerily predictable. Energy, on the other hand, is a mixed bag. The current unit cost of coal is approximately the same as it was in the year 1890 in inflation-adjusted terms. It has, however, fluctuated randomly over time by a factor of three, exhibiting short-term trends that eventually reverse themselves. The same is true of gas and oil. Nuclear has also fluctuated, but is actually more expensive now than when it was first introduced in the 1950s. In short, there’s no equivalent for Moore’s Law when it comes to fossil fuels and nuclear power. Which brings us to solar. Here the trend has been unmistakable, with the price per unit dropping a very steady 10 percent per year. This has been a very rapid decline with little variability. Despite changes in demand, the ebb and flow of government subsidies, solar has steadily dropped in cost. This very Moore-ish trajectory permits us to make reasonably secure predictions about the future cost of solar power. There’s a very slim chance those predictions could be wrong, but compared to predicting the cost of coal — which is akin to spinning a roulette wheel – we can get some glimpse of the future. And that future will almost certainly be dominated by solar — not because it’s “green,” but because it’s cheap. Indeed, the authors’ data suggests that there’s a fifty-fifty chance that solar will become competitive with coal as early as 2024; there’s a good chance that could happen even sooner. Indeed, it already has in some countries. In the near future, it will likely be the coal industry that will need subsidies to compete with solar, not the other way around. 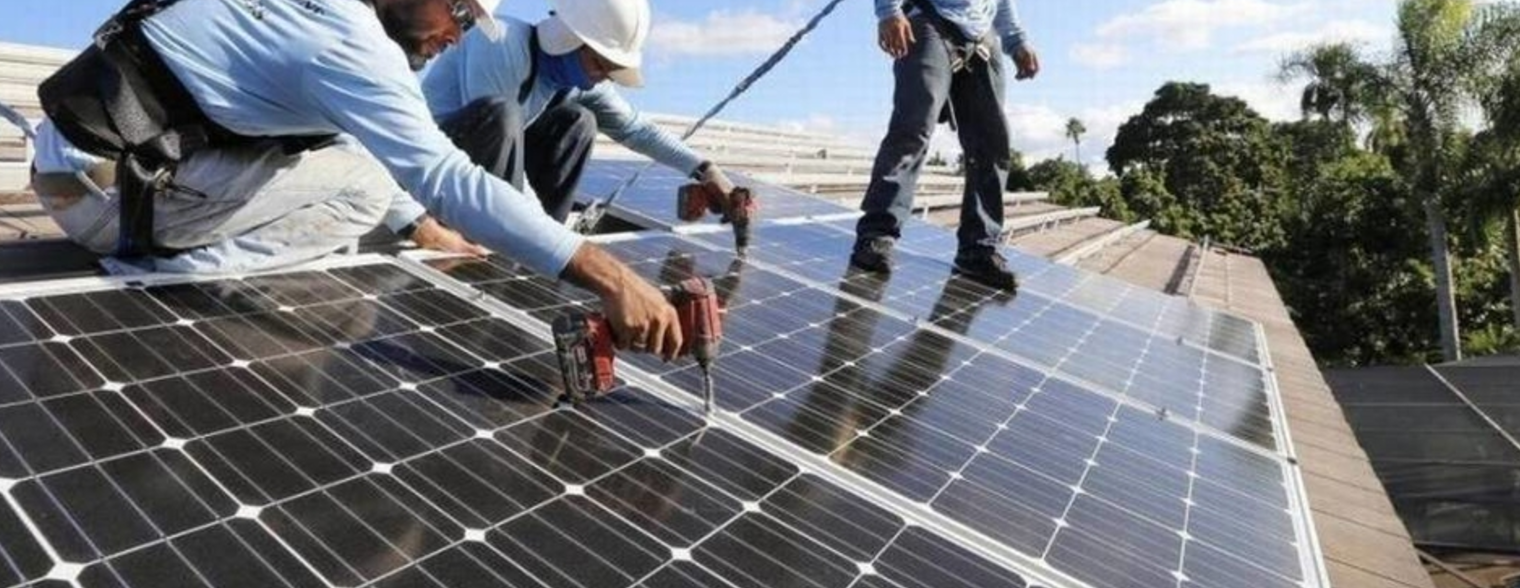 Anyone building a new house in South Miami — or in some cases renovating existing ones — will have to install solar panels after the city commission approved a groundbreaking law Tuesday night.
MIAMI HERALD — The measure, the first of its kind in Florida, will go into effect in two months on Sept 18. The ordinance passed 4-1 Tuesday night, with commissioner Josh Liebman dissenting. Under the rules, new residential construction would require 175 square feet of solar panel to be installed per 1,000 square feet of sunlit roof area, or 2.75 kw per 1,000 square feet of living space, whichever is less. If the house is built under existing trees, the shade may exempt it. Home renovations that replace more than 75 percent of the structure or extend the structure by more than 75 percent would also have to follow the new ordinance. South Miami Mayor Philip Stoddard, a biology professor at Florida International University, has championed this measure. His entire home runs on solar and he drives an electric car. His monthly electric bill is about $10. “Solar reduces the cost of home ownership, it makes houses sell faster, it returns more to a builder, it makes local jobs, and most importantly, it reduces carbon emissions today to help our children and grandchildren have a better future tomorrow,” he said Tuesday night. Liebman said Tuesday night he is not against solar, but supports “the freedom of choice’’ for the city’s residents. He also said he was concerned that nearly 7 percent of the city’s budget comes from fees the utility pays to the city. The commission had approved the law on first reading in early June but then tabled it on June 20 to make sure that the new regulations were in line with Florida’s building code.  As if air travel wasn't already stressful enough, last month American Airlines was forced to cancel dozens of flights from Phoenix when temperatures of nearly 120 degrees made it too hot for smaller jets to take off.
MSN — Now, a study finds such heat-related flight disruptions will become more common in the next few decades as temperatures rise because of global warming. Blistering heat waves like the one that scorched the Southwest in June will make it harder for aircraft around the world to take off, according to the report published Thursday. Extreme heat affects a plane's ability to take off. Hot air is less dense than cold air, and the hotter the temperature, the more speed a plane needs to lift off. A runway might not be long enough to allow a plane to achieve the necessary extra speed for a safe takeoff. That means weight must be dumped, or the flight is delayed or canceled. By the end of this century, heat waves are forecast to become more commonplace, with high temperatures at airports around the globe predicted to soar anywhere from 7.2 to 14.4 degrees above current levels by 2080, according to the study. These intense heat waves would cause the most problems. “This points to the unexplored risks of changing climate on aviation,” said study co-author Radley Horton, a climatologist at Columbia University’s Lamont-Doherty Earth Observatory. The issue adds to a growing list of aviation-related problems because of global warming, including increased turbulence, stronger headwinds and swamped airport runways due to rising sea levels, he said. Tom Nolan, executive director of the Palm Springs International Airport, said the airport operates routinely in high heat. Temperatures in Palm Springs have reached 122 degrees four times this summer, and only a handful of flights have been delayed because of heat. Nolan said he expects aviation technology to advance quickly in the coming decades, outpacing rises in ground temperatures. “It’s quite obvious, at least from my perspective, that the changes in engine technology – meaning more efficiency, more horsepower, less fuel consumption; the design of the fuselage and the wings, creating more efficiency with less energy; the use of composites in aircraft making them lighter… That in itself has advanced so quickly that even two decades from now you’ll see dramatic advancements in how aircraft works,” Nolan said. “Technology has got the upper hand and will stay well ahead of that and counter-balance” the effects of global warming. On average, 10%–30% of flights departing at the hottest time of day would require some form of weight restriction toward the end of the century, the study determined. It also found that if greenhouse gas emissions continue unabated, aircraft fuel capacities and payload weights will need to be reduced on the hottest days for some planes. "Adaptation may be required in aircraft design, airline schedules and/or runway lengths," the authors wrote. However, the authors noted that technological change, including improvements in engine performance and air frame efficiency could alleviate the effects of rising temperatures to a degree. The study, the first such worldwide analysis, appeared in the peer-reviewed journal Climatic Change. 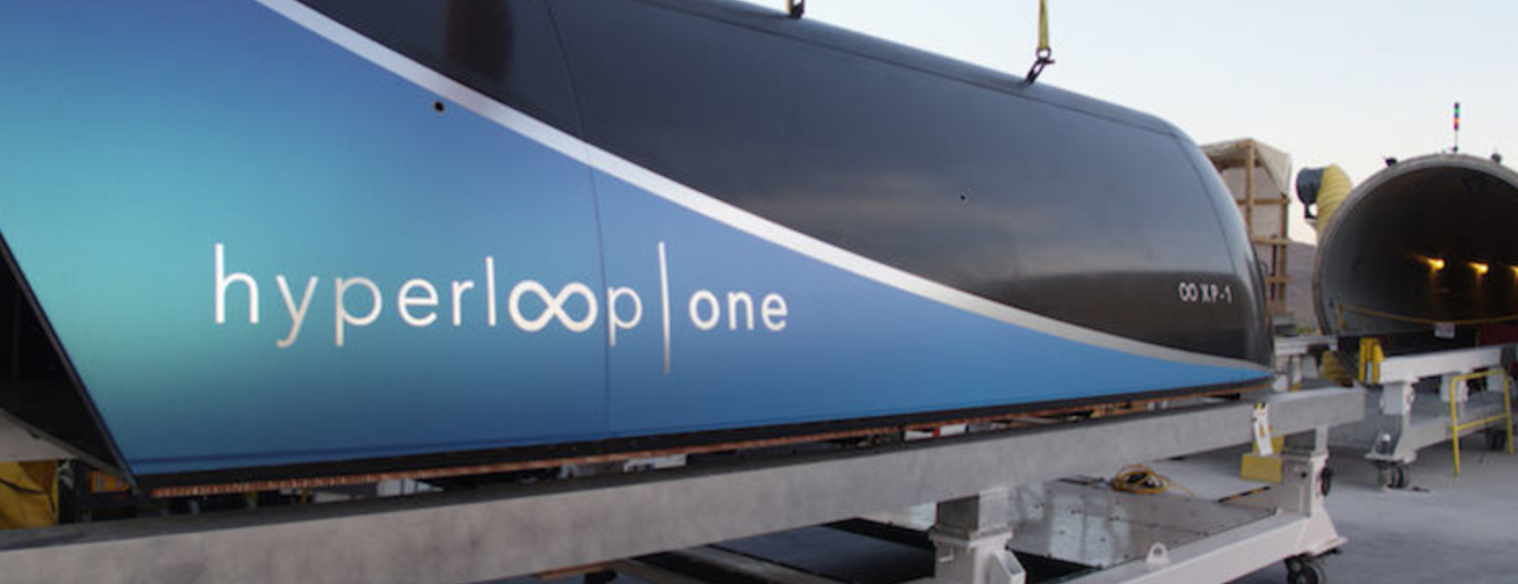 Hyperloop has reached perfect vacuum conditions and speeds of 110 km/h (70 mph) in its first fully fledged trial. It is promising news for a system that could change the way we travel worldwide, with projects already suggested in Europe, the U.S., and Asia.
THE FIRST HURDLE FUTURISM — In its first full system trial at the test track in Nevada, Hyperloop One has successfully created vacuum conditions that allowed it to travel at speeds of about 110 km/h (70 mph). While this does not seem dizzyingly fast, it means that the system achieved its primary function of reducing air resistance to a level similar to a plane flying at 61,000 meters (200,000 feet) — this is what will, eventually, allow it to travel at hyperspeed. The achievement marks a successful jump over the first hurdle in a series that will lead to the Hyperloop’s implementation. The next test it will undertake is to travel 400 km/h (250 mph) on the same track, although the final goal will be to travel at speeds of up to 1,200 km/h (750 mph) in a real world setting. This break-neck speed should be easier to achieve on the intercity tracks that will be significantly longer track than the test course in Nevada, which would allow the pod to build up a little more steam. CITY TO CITY TRANSPORT Hyperloop has significant advantages for travelers, the economy, and the environment. Eventually, it will be able to travel far faster than any method of land based transport currently available — with its closest competitor, the bullet train, only capable of speeds of 320 km/h (200 mph). Projections indicate that it will also be cheaper to build than bullet train systems. To compare, California’s bullet train will cost $12.7 billion to install, while Elon Musk predicts a Hyperloop will cost $7.5 billion. The hyperloop will also beat out other means of transportation for convenience and value — it is designed to arrive at stops every 30 seconds. Due to this increased frequency and decreased cost, the hyperloop offers a viable alternative to road-based transport, which means that it will lower our emissions of greenhouse gases — a characteristic augmented by the installation of solar panels on the roofs of the carriages. The increased speed is particularly good new for Dubai and Abu Dhabi — which are its two planned inaugural projects. The makers of the hyperloop have also recently released a list of U.S. locations and a shortlist of potential European cities that could have the system installed — it is rumored a hyperloop will connect the entire continent by 2021. 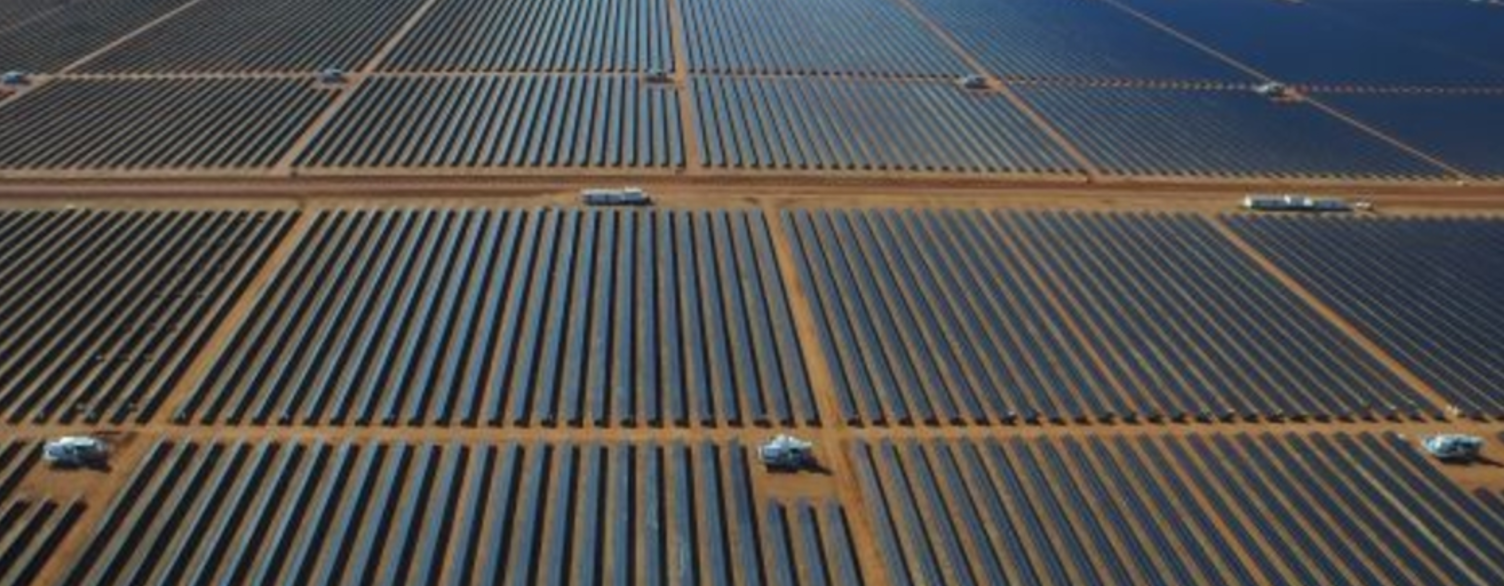 The federal government in Australia has yet to commit to a renewable energy target, but that has not stopped the state of Victoria from setting its own.
FUTURISM — The state has developed a green energy plan meant to increase reliance on renewable energy while decreasing dependence on fossil fuels. This action plan was officially launched Thursday by former U.S. vice president and global clean energy advocate Al Gore. The government of Victoria is dedicating $146 million to its plan, and the money will go toward several initiatives. One is the creation of a battery storage facility capable of delivering four hours of power to the 100,000 people living in two regional towns in the state. $8 million will be used for various small-scale “micro-grid” initiatives, which would create local micro-grids that are independent from the national energy grid. The state will buy $48.1 million in renewable energy certificates, as well, some of which will be used to provide solar power for Melbourne’s 410 trams. During the launch event, Gore rode one of those trams and spoke about the global shift toward renewables. “All over the world there has been a dramatic change in the marketplace, with electricity generated with renewable sources falling below the cost of electricity generated by fossil fuels,” Gore said, according to local daily The Age. Victoria aims to have 40 percent of its energy needs met by renewables by 2025 and be completely carbon neutral by 2050. This action plan puts them on the path to achieving those goals and sets an admirable example for the rest of the world. 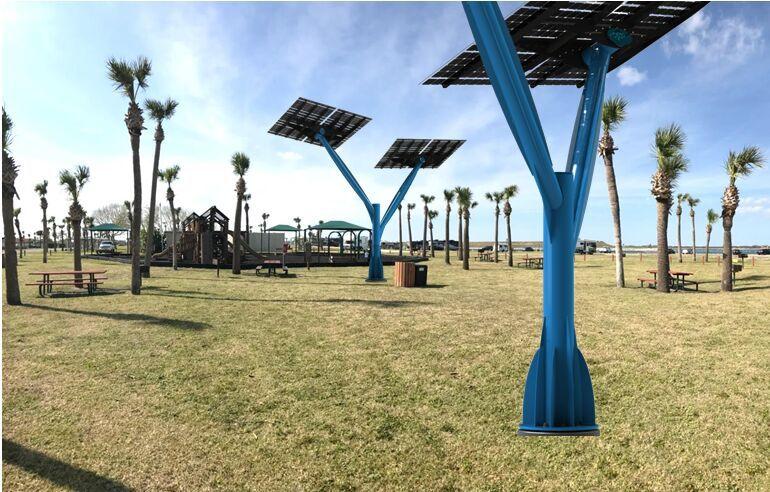 Florida Power & Light is planting large devices across Florida that look like trees and harness the power of the sun to create electricity.
SUN SENTINEL — The utility has begun installing these 24-foot-tall, solar-powered “trees” to bring attention to the use of solar energy. Boynton Beach in recent weeks installed two of them at Oceanfront Park, 6415 N. Ocean Blvd., becoming the first city in Palm Beach County to offer the solar installation as a public amenity. In Davie, West Palm Beach and Miami, FPL also has installed solar “canopies,” larger devices that provide shade over cars in parking lots, in addition to generating electricity. FPL’s pilot program, called SolarNow, kicked off two years ago, allowing customers across the state to opt into a $9 extra charge on their monthly bill to fund public solar-power generation. More than 450 Boynton customers opted into the program. Tall, bright blue and Y-shaped, Boynton’s solar trees have USB ports and outlets where parkgoers may plug in to charge their cellphones. The presence of the solar trees gives the public a chance to learn more about the technology, said FPL spokeswoman Alys Daly. “The great thing about these solar trees is that we’re locating them in communities where people have an opportunity to see and learn about solar,” Daly said. “Many people haven’t experienced solar because it’s out of sight on a rooftop somewhere, but you can’t miss [the trees].” In Boynton, FPL soon will put the finishing touch on the new trees in the park: educational boards that explain how light goes into the panel and is converted into energy, she said. “They are a tremendous educational tool for folks to see what solar energy looks like and interact with in a way that they haven’t been able to before,” she said. Boynton residents soon will start seeing more solar energy structures around the city. Officials recently approved plans for solar canopies at Oceanfront Park, and Barrier Free Park, 3111 S. Congress Ave, Daly said. They’ll be added within the next four months. FPL also will pay the city about $4,000 per year to lease the land used for the solar structures. A solar tree costs between $22,000 and $32,000, depending on the structure and style of the device, Daly said. A 200-kilowatt canopy costs about $950,000, she said. Other South Florida cities are joining in on the effort to promote solar energy. On Tuesday, the Pompano Beach City Commission gave initial approval to add solar trees and canopies in five locations, including the parking lots of City Hall, the Cultural Center and a fire station. The city also may upgrade the canopies to electric car charging stations. Last year, FPL installed solar canopies at the Young at Art Museum in Davie and the Palm Beach Zoo in West Palm Beach. One of the solar trees in Oceanfront Park stands tall over the Turtle Cafe, where Solange Arias works. The 34-year-old said she is excited about the solar trees and the opportunity they offer to promote solar power. “I hope more and more people start to use them and they’re able to install even more of them,” she said. “And as an added bonus, they just look so pretty.”  The mercury soared to 98 degrees Saturday afternoon in Downtown Los Angeles—shattering one of LA’s oldest daily heat records. CURBED — The previous record of 95 degrees was set 131 years ago in 1886. (Fun fact: Downtown LA’s longest-standing heat record is on March 28, when the temperature hit 90 degrees in 1879, according to the National Weather Service). Southern California is sweating through a heatwave brought on by a high pressure system hovering over the southwest United States. Temperatures picked up Thursday and really started to sizzle on Friday with more than a half-dozen new heat records set from Palm Springs to Woodland Hills. The Weather Service had forecast high temperatures on Saturday of up to 110 degrees in neighborhoods “away from the coast.” Temperatures closer to the beach were predicted in the 90s. Heat alerts have been issued for the San Fernando Valley, Pomona, and the Santa Clarita Valley, and public health officials are encouraging residents who don’t have air conditioning at home to head over to their nearest cooling center. Residents seeking relief might want to consider heading to the beach. The Weather Service says, “The coastal plains will see a strong difference between the beaches and a few miles inland, where temperatures could vary by more than 20 degrees.” Where did this extreme heat come from and when will it end? Here’s what you need to know: 1. When will temperatures peak? The mercury is forecast to soar to its highest point Saturday. 2. How hot will it get? Pretty hot. In the Valley, Woodland Hills and Burbank are expected to tie or break their heat records on Friday and Saturday, with temperatures of 112 and 104, respectively. UCLA is forecast to break its record, too, with two days of 94-degree temperatures expected on Friday and Saturday. The Weather Service accurately predicted that the record for Downtown Los Angeles would fall on Saturday. Its forecast a high of 96 degrees; it turned out to get even hotter than that. 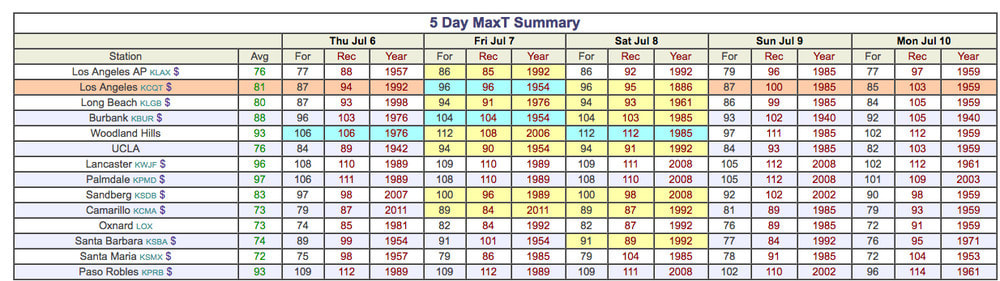 Via National Weather Service Los Angeles/Oxnard 3. What records have already been shattered?
The most wild record was notched Friday in Palm Springs, where the Weather Service recorded a high of 122 degrees. That smashed the record of 117 degrees set more than four decades ago in 1976. On Friday, the other notable one was at Pierce College in Woodland Hills, where the Weather Service recorded a high of 109 degrees, besting the 2006 high temperature of 108 degrees. 4. Is this normal? Bill Patzert, a climatologist for the Jet Propulsion Laboratory, tells the Los Angeles Times that Southern California’s warmest months are traditionally August and September, and that the heat waves are “definitely coming earlier this year.” |
James Ramos,BPII'm your go to solar energy expert here to guide you step-by-step through all of your solar options. Categories |
James The Solar Energy Expert
 RSS Feed
