|
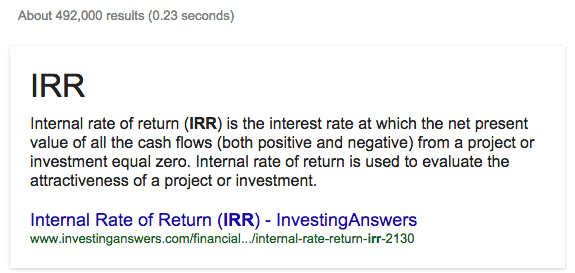
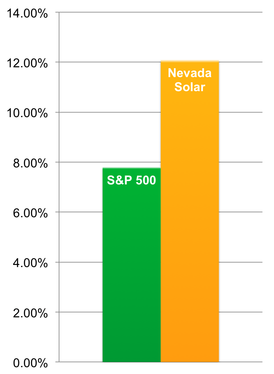
It may sound daunting at first, but understanding the financial return of investing in solar can greatly simplify the decision-making process. SOLAR POWER ROCKS — An internal rate of return, also called an economic rate of return (ERR) or discounted cash flow rate of return (DCFROR… seriously?), is an indicator of the yield of an investment. It’s a figure often used to measure and evaluate long-term investments. As a result, the internal rate of return makes comparing potential investments of equal lifespan relatively easy. But how does it achieve this? Let’s break down the complicated definition you’ll find on Google. I’m going to be honest, I’ve read it three times and I still don’t know what it’s saying – except for that last line. Let’s start there. The IRR is used to evaluate the attractiveness of a project by quantifying the long-term profitability, making it easy to compare to other potential investments. Generally speaking, the greater a project’s internal rate of return, the more desirable the project. To put this figure into perspective, the S&P 500 has an average IRR of 7.81% over the past twenty years. However, you might be surprised to find that solar policies have enabled solar returns to consistently outpace this rate, such as in the example later in this post. Solar IRRs are also more stable than that of market indices, due to the predictability of the sun coming up everyday, increasing electricity prices, and equipment performance.  Solar stomping the S&P 500’s IRR Anyway, onto the hard part. By adding up the present values of all the annual cash flows and setting this sum, the net present value, equal to zero, the internal rate of return is revealed. The equation for present value looks pretty intimidating: The present value of each annual cash flow entry can be calculated using this equation, then added together to produce the net present value, which will come out to zero if the correct IRR has been used. This calculation is annoyingly complicated by the fact that present values are calculated using this same rate value, making the process of solving for the IRR an iterative one. Let’s look at an example to better understand what any of this means. Example Internal Rate of Return Calculation for an Average (5kW) Solar System Where better to start than sunny Nevada? Below is a table based on the numbers you’ll find on the Nevada Solar Page example. The table shows an example cash flow for the purchase and return on a 5kW solar system over 25 years. For each cash flow entry, there is a present value, calculated using an IRR of about 12.1%. By adding up the present values, a total of zero is produced, indicating that this is an accurate IRR figure for the solar project. 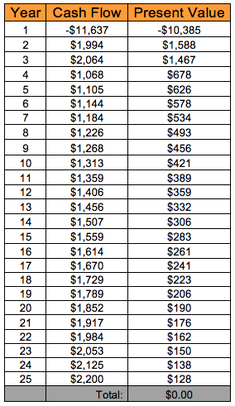 Fortunately, tools like Microsoft Excel’s IRR formula exist to do the grunt work for us, otherwise determining the IRR to be 12.1% would have been a tedious process. While spreadsheets can easily calculate the internal rate of return, they fail to express the meaning of the IRR and the risks associated with these projects. Not that smart are ya now, computer?
Interpreting the Internal Rate of Return As you may have picked up on by now, the IRR draws its significance through comparisons, and the most fundamental comparison to be made is between a project’s IRR and the investor’s cost of capital. I think we’ve learned enough for one blog post, so let’s just skip to the layman’s definition of cost of capital: it is the minimum return that you can expect from your investments, setting a benchmark for alternative projects to meet. So an investment whose IRR exceeds its cost of capital is economically profitable! One of the largest factors in determining the payback period of a solar system is the cost of future electricity. Being unable to predict the future, anticipated rate increases vary from 1.5% up to 6% annually. However, conservative estimates can be made based upon historical rate increases, diminishing the risk associated with this key assumption. Further consideration must be paid to the predictions associated with incentive payments and equipment performance. While some incentives are hopefully here to stay, such as the almighty 30% federal tax credit, the state of Solar Renewable Energy Credits (SRECs) and other performance-based incentives have a murky future and pose a risk that should be taken into account when crunching the numbers on solar. Ending on a good note, equipment performance and maintenance pose a very low risk due to the high predictability of array performance and the rugged nature of modern solar panels. Conclusion Comparing potential investments is made easier by taking a peek at the projects’ respective IRRs. When considering whether to get solar, it’s important to look at the internal rate of return associated with your quote and compare this number to other potential investments over the same time period. The best way to learn more about your roof’s solar potential is to get in touch with a solar advisor.
0 Comments
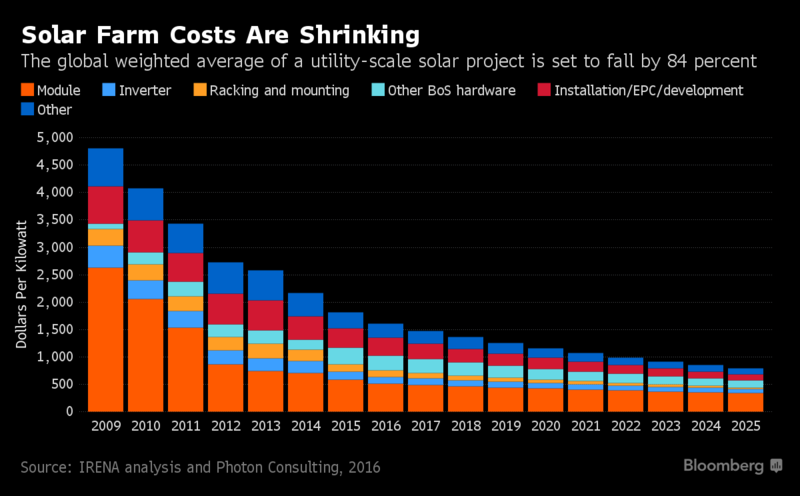
Solar power is now cheaper than coal in many parts of the world. In less than a decade, it’s likely to be the lowest-cost option almost everywhere. BLOOMBERG — In 2016, countries from Chile to the United Arab Emirates broke records with deals to generate electricity from sunshine for less than 3 cents a kilowatt-hour, half the average global cost of coal power. Now, Saudi Arabia, Jordan, and Mexico are planning auctions and tenders for this year, aiming to drop prices even further. Taking advantage: Companies such as Italy’s Enel SpA and Dublin’s Mainstream Renewable Power, who gained experienced in Europe and now seek new markets abroad as subsidies dry up at home. Since 2009, solar prices are down 62 percent, with every part of the supply chain trimming costs. That’s help cut risk premiums on bank loans, and pushed manufacturing capacity to record levels. By 2025, solar may be cheaper than using coal on average globally, according to Bloomberg New Energy Finance. “These are game-changing numbers, and it’s becoming normal in more and more markets," said Adnan Amin, International Renewable Energy Agency ’s director general, an Abu Dhabi-based intergovernmental group. "Every time you double capacity, you reduce the price by 20 percent.” Better technology has been key in boosting the industry, from the use of diamond-wire saws that more efficiently cut wafers to better cells that provide more spark from the same amount of sun. It’s also driven by economies of scale and manufacturing experience since the solar boom started more than a decade ago, giving the industry an increasing edge in the competition with fossil fuels. The average 1 megawatt-plus ground mounted solar system will cost 73 cents a watt by 2025 compared with $1.14 now, a 36 percent drop, said Jenny Chase, head of solar analysis for New Energy Finance. That’s in step with other forecasts.
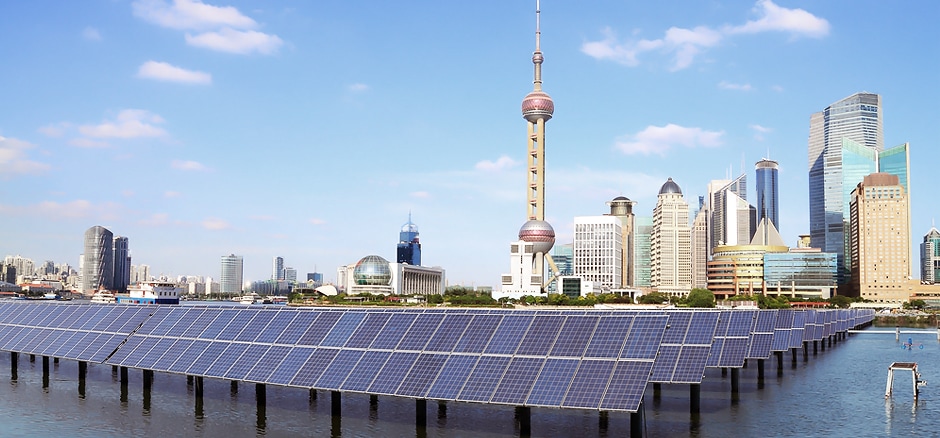
In China, the biggest solar market, will see costs falling below coal by 2030, according to New Energy Finance. The country has surpassed Germany as the nation with the most installed solar capacity as the government seeks to increase use to cut carbon emissions and boost home consumption of clean energy. Yet curtailment remains a problem, particularly in sunnier parts of the country as congestion on the grid forces some solar plants to switch off. Sunbelt countries are leading the way in cutting costs, though there’s more to it than just the weather. The use of auctions to award power-purchase contracts is forcing energy companies to compete with each other to lower costs. An August auction in Chile yielded a contract for 2.91 cents a kilowatt-hour. In September, a United Arab Emirates auction grabbed headlines with a bid of 2.42 cents a kilowatt-hour. Developers have been emboldened to submit lower bids by expectations that the cost of the technology will continue to fall. “We’re seeing a new reality where solar is the lowest-cost source of energy, and I don’t see an end in sight in terms of the decline in costs,” said Enviromena’s Khoreibi. Installing solar panels can significantly increase your property’s value, according to a new study from the Lawrence Berkeley National Lab (LBL).
ENERGYSAGE — The report, titled “Selling into the sun: Price premium analysis of a multi-state dataset of solar homes“, builds on previous research which concluded that homes with solar panels in California sold for more than those without. In addition to California, the new study investigates home pricing trends Connecticut, Florida, Massachusetts, Maryland, North Carolina, New York and Pennsylvania by analyzing the sales of over 20,000 homes in these states. LBL’s analysis of the housing markets in these other states shows that the premium paid for homes with solar is not a phenomenon isolated to the Golden State. The takeaway is this: If you are thinking about purchasing a solar system for your home, the study’s conclusions should give you a boost of confidence that you are making a smart investment. LBL finds that homes with solar panels will benefit from a ‘solar premium’ when they are sold because buyers are willing to pay more for a home with solar panels. How Much Does Solar Power Increase Property Values? The solar premium is how much more your home will be worth with a solar panel system as opposed to without one. Here’s an example: if your home has a 3.6 kilowatt (kW) solar system (the national average) on its roof, this means you have 3,600 watts of solar power (1kW = 1,000W). LBL says that each watt of solar you have will add approximately $4 to your home’s value if you live in California and about $3 if you live elsewhere. This means that, thanks to your 3.6kW solar system, your home should sell for about ($4 x 3,600W =) $16,000 more if you live in California or about ($3 x 3,600W =) $12,700 more if you live outside of California. Specifically in this state analysis, prospective buyers wondering if solar panels increase home value were pleasantly surprised. What is surprising about these figures is that they are very close to what you would pay for a brand new solar system today. Our own analysis of prices for 6kW solar systems in California reveals that some of the more expensive systems cost just over $4/W. And bear in mind that these prices are what you would pay before you take into account the generous 30% Federal tax incentive that is available until the end of 2016. The report notes that the difference between the solar premium for solar panels in California as opposed to the non-Californian states is “not statistically significant”: The lower premiums may be due to “lower net costs and income estimates” in the other states. In essence, the premiums in non-Californian states may have to do with lower solar installation prices and electricity rates rather than because solar has a lower valuation there. All of this suggests that if you sell your house soon after you have solar system installed, you will recoup most or all of your investment, even as you save money on your power bills. It also confirms what we’ve said before: Payback periods on solar power systems are not something to be overly concerned about. Your solar system will either increase your home value significantly should you decide to sell your house, or it will pay itself off in power bill savings before you move out. In both cases, solar is a sound investment. With so many trendy investment opportunities available in today’s day and age, it’s easy to be skeptical of new products that boast promises of “saving you tons of money.” ENERGYSAGE — Solar panels are no different – saving money through reducing your electric bill is one of the main appeals and selling points for solar as a product and home upgrade. The simple answer to the question “do solar panels really save you money?” is yes. That being said, how much you’ll save depends on a number of factors. Direct hours of daily sunlight and size of roof are both important, but local electricity rates play the biggest role in determining how much solar can save you. How much do solar panels save on electric bills? The first step to understanding how much solar can save you is to calculate how much you are currently spending on electricity every year:
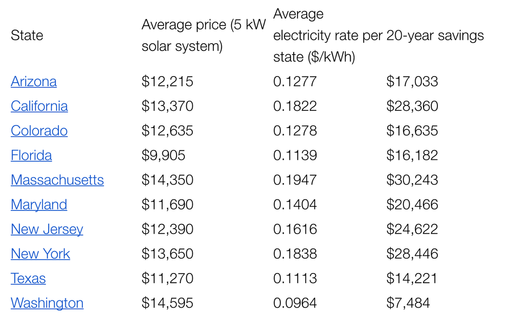
When you compare the cost of utility electricity with home solar, you should keep in mind that you can expect electricity rates to increase annually. Over the past decade, national electricity costs have increased at a rate of 2.2% per year. Utility rate inflation is an added incentive for solar: when you generate your own energy with a rooftop PV system, you’re taking control of energy costs so that you are no longer victim to changing utility rates. To provide a snapshot for typical bill savings from a solar installation, the following table offers state-by-state data for 20-year savings estimates with solar. The data incorporates a number of assumptions:
Solar panels reduce your carbon footprint
Financial returns are a major incentive for going solar, but money isn’t the only thing that solar panels save. When you install solar, you’re also improving the environment and reducing greenhouse gas emissions. That’s why the question “How much can solar panels save?” can be answered two ways: how much money solar can save and how much CO2 it can save (avoid being emitted into the atmosphere). Solar panels can create big savings Ultimately, regardless of whether you’re looking at finances or carbon emissions, a solar panel system will generate big savings for homeowners. As the first data table illustrates, 20-year electricity savings from solar can be significant, ranging from the low end of $7k to upwards of $30k. The deciding factor will primarily be the cost of electricity, which varies significantly depending on where you live. Nonetheless, a good rule of thumb is if you live in a state with middle- to upper-level utility rates, solar will be a risk-free investment with major returns. On the emissions side, as panel system size increases, so do the CO2 reductions in the surrounding environment, making solar an eco-conscious investment. Those considering solar power for churches, temples, mosques, and other houses of worship are discovering that installations are getting both easier and cheaper. Since 2009, costs for non-residential solar installations have dropped around 73%.
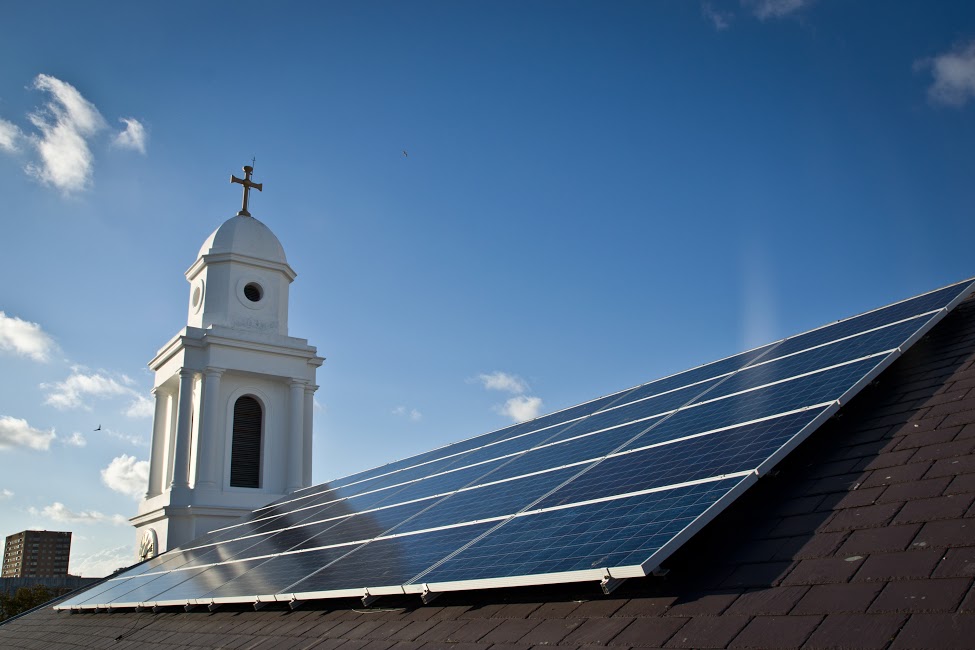
Solar Power for Churches is Trending In Minnesota, roughly 400 congregations are working with Minnesota Interfaith Power and Light (MNIPL), a faith-based nonprofit concerned with climate change and environmental stewardship. Twenty Minnesota churches completed their transition to solar power in 2016. Joel Norton, a member of St. Christopher’s Green Team, says that the church worked with a local solar installer, applied for a federal tax rebate program, and took advantage of the Made in Minnesota solar incentive program. In Roseville, St. Christopher’s Episcopal Church also completed it’s solar rooftop installation last year. The church secured $119,000 in funding for the project through federal and state programs, and worked with a local solar installer. To date, the panels have saved 35 tons of CO2 from entering our atmosphere, and also importantly, the church has “significantly reduced the monthly electric bill.” St. Christopher’s team designed the solar panel installation to leave the shape of a cross exposed on the church’s roof. Norton explains that it’s in the hands of the faithful “to preserve God’s creations.” Community Solar Farms Offer Additional Solutions At New Life Presbyterian Church in Roseville, the Sustainable Energy Task Force has been researching solar power for churches for several years. Although they haven’t completely given up on installing solar panels on their own building, they are currently constrained by a rooftop covered in shade and compressors. “It’s not a great fit for a solar array,” says Task Force Chair Kate Wolfe-Jenson. MNIPL’s Nerbonne confirms that most organizations want on-site solar panels. However, as in New Life Presbyterian’s case, a share in a community solar farm is often the next best solution. With its new contract for community solar, New Life Presbyterian will lock in the benefits of clean, renewable solar power for the next 25 years without taking on all the costs of an on-site installation. Andy Stahlman, a sales representative for Innovative Power Systems (IPS) in Roseville, MN, is working with around 10 faith communities, including New Life Presbyterian. He explains, “when IPS contracts with a faith community or other nonprofit, it owns the solar power system, so nonprofits don’t pay out of pocket and the developer receives both federal tax rebates and part of the organization’s electric bill credit.” “Tons and Tons of Faith Communities Doing Solar” An additional bill credit especially relating to solar power for churches, faith-based organizations, and other nonprofits may be approved in March 2017, by the Public Utilities Commission. In St. Paul, a group of around 8 faith communities have a dream of building a community solar garden in the east metro region. MNIPL’s Nerbonne explains that MNIPL is working with the church leaders on the details of location and financing. They are waiting for the Public Utilities Commission’s decision in March before applying to the state for funding and other incentives. Nerbonne notes, “Between looking for the best deal and understanding how the financing works, transitioning to solar can feel daunting.” However, she explains, “All of a sudden, the market has come into balance where now, even without big incentives like Made in Minnesota, it’s worth it for these congregations.” She adds, “Low-income faith organizations historically have written off solar power as an option for only the rich, but they shouldn’t.” In fact, interest in community solar power for churches and other faith groups is on the rise as an inspirational solution to transitioning to clean energy. In 2016, Nerbonne states, “More than two dozen faith groups have expressed interest in community solar.” “I think we are just on the brink of tons and tons of faith communities doing solar,” says Nerbonne, adding, “I think we have literally just begun.” When it comes to supporting renewables, blue and red make green.
NRDC — Among a dwindling number of politicians at the national level, there’s a pretend debate going on. Using all the scare tactics and rhetorical tricks they can muster, some apologists for the fossil fuel status quo would have you believe that we, as a nation, are divided about whether or not to move forward aggressively with clean, renewable energy like wind and solar. But the simple truth is that there is no debate: The national verdict on renewables is already in. However they may have voted in the presidential election, Americans—of all political stripes, in red states and blue ones—are overwhelmingly voting yes on clean energy. Whether it’s because it’s good for the economy, the environment, consumers, or all three, citizens and their elected officials at the state level are throwing their full support behind the next energy revolution. For evidence of clean energy’s bipartisan and cross-cultural appeal, one need look no further than the American heartland—the same part of the country that gave Donald Trump his victory—where governors, legislatures, and voters have come to see investment in renewables as something to be embraced wholeheartedly and unequivocally. In the weeks just after the election, while many of us were nervously wondering what our national energy policy would look like under a President Trump and a Secretary of Energy Rick Perry, three of these states undertook significant measures to protect, or even improve, their efficiency and renewable energy standards. In Michigan last month, a legislative package that began its life as an attempt by some lawmakers to roll back the state’s clean energy goals ended up being transformed into a set of bills that not only preserves them, but actually makes them stronger. Just before Christmas—and after much bipartisan negotiating—Republican Governor Rick Snyder personally inserted himself into the debate and ultimately sealed the deal by putting his signature on laws that will increase Michigan’s renewable energy portfolio standard from 10 percent to 15 percent while simultaneously fostering greater efficiency. In Illinois, Republican Governor Bruce Rauner recently signed the Future Energy Jobs Bill, passed by his state’s Democrat-controlled legislature and designed, among other things, to ensure that more than $200 million a year gets channeled into renewable energy investment. Under the new law, the state’s largest electric utility will also increase efficiency to reduce demand from customers by more than 20 percent by the year 2030. Both measures will greatly help Illinois reach its goal of getting a quarter of its energy from renewables by 2025. Meanwhile, in Ohio, Governor John Kasich has just defied members of his own party by vetoing a bill that would have continued a deplorably cynical freeze on the state’s move toward renewable energy. In defending his veto, the Republican and 2016 presidential candidate cited the economic harm that would befall his state were it to abandon its sizable investments in the clean energy sector, which currently employs nearly 90,000 Ohioans. Each of these happy developments represents another forceful refutation of all the shopworn clichés about clean energy: that it’s practically unfeasible, for instance, or that it’s somehow inimical to job growth, or that it’s something only tree huggers care about. More and more, these clichés are being revealed for what they are: desperate and outdated political posturing. Republicans in Washington, D.C., who stubbornly cling to them should take a lesson from their counterparts in heartland states—and not just the aforementioned ones, but also states like Texas and Iowa—and get with the program. If they don’t, they’re going to look even more out of touch with public sentiment than they already do. One can imagine that when the telephone or automobile (or any type of new technology) came out, there were hucksters and frauds taking advantage of the uninformed. Unfortunately, the solar industry is going through these growing pains.
GREENTECH MEDIA — Solar technology is not new — solar panels have been on satellites since the 1950s — but a combination of factors has allowed the solar industry to explode worldwide over the past five years. While annual solar installations in the United States have skyrocketed over 300 percent from five years ago, customer education has lagged behind. From residential to commercial, we are going solar in droves. An important question remains: Do we know what we are buying or signing up for? This ties into another question: What are solar companies selling? As a rule, solar companies are selling a quality product at a reasonable price. As with most rules, however, there are exceptions. Herein lies the conundrum — the customer's solar education is being conducted by the salespeople who are selling the product. Further confusion is created by the complex nature of not only the technology, but the finance terms as well. In addition, the education involves an understanding of something that a large segment of the population doesn’t understand — their electric bill. The following list can be used as a helpful guide to understand what is being sold and what questions should be asked. Understand what you are currently paying Depending on the utility company, the electric bill can be simple or complex, but for the layperson, it usually requires some sort of explanation. In most cases there are three to five parts of the utility bill: Service charge: It might have different names, but it’s basically a flat monthly fee for doing business with the utility. This can be as low as $1 for residential. Going solar will not change this cost. Generation charge: This is the actual cost of the electricity that is used. It can be generated by many entities using various methods, including: nuclear, coal, oil, etc. The cost is charged in increments of kilowatt-hours, or kWh, and can range from $0.06/kWh to $0.40/kWh. Going solar will change the usage and overall cost. Delivery charge: This is the charge to transport the electricity to your location. This can vary greatly, even within the same utility region. This is also charged in kilowatt-hour increments. Going solar will change the usage and overall cost. Demand charge: This charge is often misunderstood, and different utilities process it differently. It is used to analyze the maximum amount of wattage that a location needs at any one time during the month. It can be understood as how big the pipe needs to be in order to ensure that the location has enough electricity at its peak demand. This charge varies greatly. Going solar might affect this number, but it’s hard to quantify so it is generally considered a charge that will not change with solar. Time-of-use billing: In some regions there are different electricity rates for different parts of the day. Solar may affect the cost of this charge, depending on the TOU rates and times. A solar PV system, together with a battery system, might work well to alleviate this charge. Takeaway: Solar salespeople may identify what a customer is currently paying in a less-than-honest manner. Using this analysis, you should be able to calculate what you’re actually paying just by looking at your bill. Understanding the solar PV system There are many variables when it comes to the actual solar system, but the hardware portion usually comes down to three main parts: the solar panels, the inverters and the racking. Solar panels: This is the main component, and the most expensive. They are generally rated by the amount of watts produced in an hour under rated conditions. Utilizing this rating, you can compare the basic production numbers between different panels; for example, a 320-watt panel will produce more electricity than a 260-watt panel. Generally, the higher the efficiency, the costlier the panel. This higher cost can be reflected in the lease, PPA, financing and overall return on investment (ROI). Takeaway: When one company quotes you a 10-kilowatt system and another quotes you a 12-kilowatt system, you should identify the per-watt price in order to make a proper comparison. Inverters: This important component converts the DC power from the panels to AC power for the grid. There are two main types: a central inverter and a microinverter. Central inverters are wired into multiple panels. Microinverters are small units that attach to each panel and convert the electricity at the panel. Takeaway: There are certain benefits in choosing a microinverter over a central inverter, but they are not always relevant. If the roof has multiple directions, or there is shade on some of the panels, microinverters might be a better solution, although most solar companies charge more for microinverters. Racking: This is the mounting that secures the panels. The main racking systems use rails, although rail-less systems are also available. Understanding the solar production estimate This is where it gets a little tricky. Production estimates can vary greatly, depending on many factors. Barring the claims of certain manufacturers that claim higher production from the same-sized systems without actually guaranteeing it, the estimate is dependent on shading, azimuth and pitch. Shading: Although it’s a simple concept, it’s not always simple to accurately calculate. Often we hear about a certain part of the roof that’s always sunny, even though there is a large tree to the south (the direction from which the sun is generally shining). Shading can come from a tree, a dormer on the roof, an adjacent roof or some other obstacle. In addition, shading varies with the seasons. During the winter, the sun is lower in the sky and any obstacle causes more shade than in the summer, when it’s higher in the sky. Solar installers use specialized shading tools that analyze, and account for, shading throughout the year. Azimuth: The solar azimuth is used to calculate the orientation of the panels toward the direction where the sun is shining from. This is equally important as the shade, as it dictates how much of the sun will be shining on the panel throughout the year. Pitch: In most cases, the pitch, or the tilt, of how the panels are laid out is the least important of the three, but it does affect production. Takeaway: Solar system production is, in some cases, the most manipulated part of the solar proposal. Estimating a higher production than a competitor is an easy way to show more value, without actually giving any. The National Renewable Energy Laboratory (NREL) operates an online calculator which calculates how much a solar system will produce. You can input different variables and learn how much electricity your system will produce each month and for the year. The data is based on historical weather data. It takes into account the location and the specifics of your system. It is not exact, but it’s an objective way to project energy production. You can use this to compare against the figures that the solar company is projecting. This is also useful when comparing competing quotes, since you can plug the numbers in to see the efficiency of each system from an objective source. As with purchasing anything, you need to educate yourself on the product that you are acquiring—and solar is no different. As a whole, the solar industry works to deliver a quality product at a competitive price. That said, you should look at a solar proposal as a starting point of what you’re being sold. Analyze the proposals with the tools at your disposal—and go solar. ANOTHER REASON TO GO SOLAR: SDG&E MAKES ITS CASE FOR RATEPAYERS TO PICK UP $379M OF WILDFIRE COSTS1/10/2017 Just before two public hearings on the matter, San Diego Gas & Electric Co. made its case to local news media Jan. 6 why it wants ratepayers to pay 90 percent of the remaining $421 million in unrecovered costs from three devastating 2007 wildfires CalFire officials have blamed on the utility’s power lines.
SAN DIEGO BUSINESS JOURNAL — Company officials asserted SDG&E properly engineered, maintained and inspected its infrastructure in advance of the Witch, Guejito and Rice fires, but that the Santa Ana winds that stoked the blazes were “unprecedented” and therefore the utility cannot reasonably be expected to have prepared for them. “If we could’ve avoided these fires, of course we would have. We just didn’t have the information,” SDG&E attorney Christopher Lyon said in one of a series of one-on-one interviews with news reporters. Since the fires, the company says it has made a “significant investment” in not only monitoring and reporting weather conditions that can give rise to wildfires, but also improving its coordination with fire agencies. SDG&E representatives declined to disclose the size of its various fire-related investments, which customers are paying for in the form of higher rates. Property owners who suffered damage from the fires brought more than 2,000 lawsuits against SDG&E. The company settled these claims for a total of $2.4 billion. While SDG&E’s insurance covered some of the costs, $421 million remains to be recovered. Investors will kick in 10 percent, which company representatives said management proposed based on a decision by the utility’s primary regulator, the California Public Utilities Commission, in a hazardous waste case from the 1990s. The remaining $379 million would be paid by SDG&E customers. If the CPUC agrees, the average residential ratepayer will pay $1.70 per month for six years to help the company recover its costs relating to the three fires. China will plow 2.5 trillion yuan ($361 billion) into renewable power generation by 2020, the country's energy agency said on Thursday, as the world's largest energy market continues to shift away from dirty coal power towards cleaner fuels.
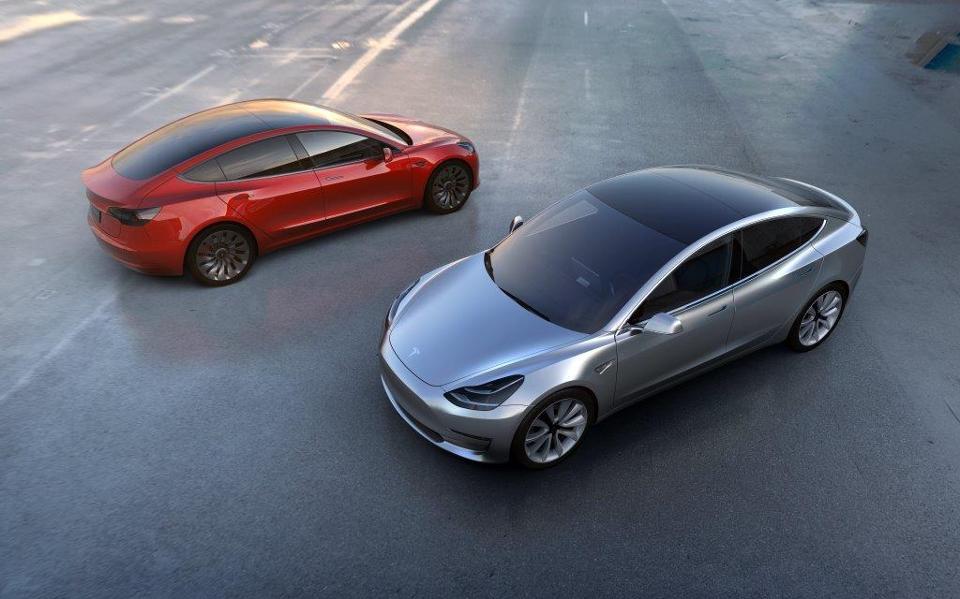
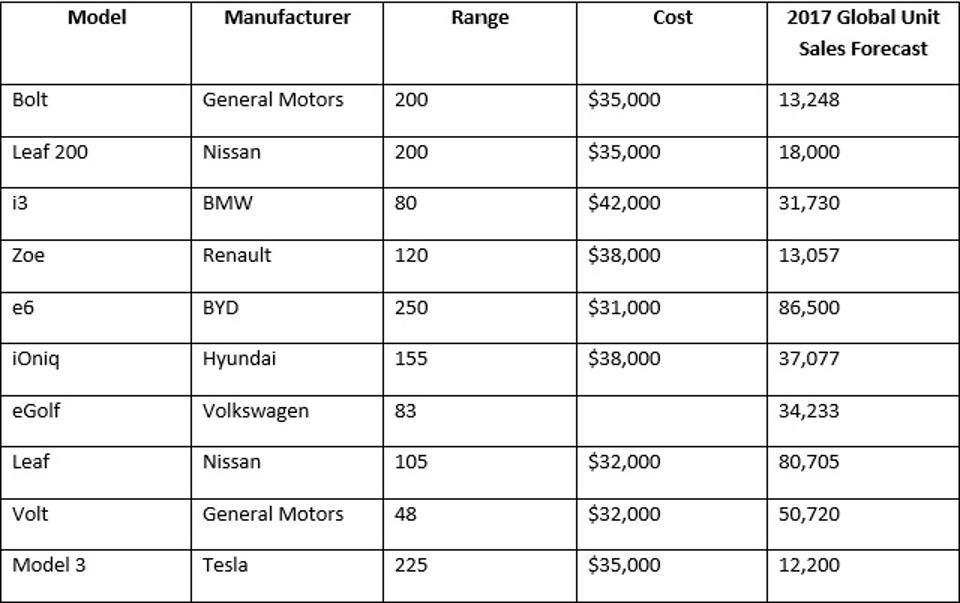
REUTERS — The investment will create over 13 million jobs in the sector, the National Energy Administration (NEA) said in a blueprint document that lays out its plan to develop the nation's energy sector during the five-year 2016 to 2020 period. The NEA said installed renewable power capacity including wind, hydro, solar and nuclear power will contribute to about half of new electricity generation by 2020. The investment reflects Beijing's continued focus on curbing the use of fossil fuels, which have fostered the country's economic growth over the past decade, as it ramps up its war on pollution. Last month, the National Development and Reform Commission (NDRC), the country's economic planner, said in its own five-year plan, that solar power will receive 1 trillion yuan of spending, as the country seeks to boost capacity by five times. That's equivalent to about 1,000 major solar power plants, according to experts' estimates. The spending comes as the cost of building large-scale solar plants has dropped by as much as 40 percent since 2010. China became the world's top solar generator last year. "The government may exceed these targets because there are more investment opportunities in the sector as costs go down," said Steven Han, renewable analyst with securities firm Shenyin Wanguo. Some 700 billion yuan will go towards wind farms, 500 billion to hydro power with tidal and geothermal getting the rest, the NDRC said. The NEA's job creation forecast differs from the NDRC's in December that said it expected an additional 3 million jobs, bringing the total in the sector to 13 million by 2020. Concerns about the social and economic costs of China's air pollution have increased as the northern parts of the country, including the capital Beijing, have battled a weeks-long bout of hazardous smog. Illustrating the enormity of the challenge, the NEA repeated on Thursday that renewables will still only account for just 15 percent of overall energy consumption by 2020, equivalent to 580 million tonnes of coal. More than half of the nation's installed power capacity will still be fueled by coal over the same period. Tesla will unveil its new small electric car in California later today, joining a throng of other manufacturers seeking to sell mass-market battery-only vehicles that probably cost about twice as much as they should, often only go half as far as claimed, but all signal the green virtue of the buyers. Sales of battery-electric cars have not kept pace with the claims of some of their most ardent fanatics. For instance, the Renault -Nissan alliance - makers of the Zoe and Leaf - have invested large sums on the bet that by 2020, 10% of all global sales would be battery-powered. Now just over 1% is the consensus projection. The likely biggest-selling electric car in the near future is going to be the Chinese BYD e6, according to Cairn Energy CRNCY +% Research Advisors. Cairn, based in Boulder, Colorado, reckons the e6 will notch up 86,500 sales in 2017. Close behind is the Nissan Leaf at a projected 80,745. Other big sellers next year will include the Hyundai iOniq (37,077) and the BMW i3 (31,730). Cairn sees only 12,200 Model 3 sales in 2017, but production will have barely gotten underway. BMW said almost three years ago that the next three to four years would bring more battery development than the previous 100 years. So far that hasn’t happened. But the new Tesla Model 3 is expected to come with very impressive credentials. Its performance, at least of the most powerful versions, will surpass the hottest versions of sedans like the BMW M3 and Mercedes C-class AMG. Eventually there will be a coupe, a cabriolet, a small SUV and maybe a pickup truck. Prices are likely to start at $35,000. According to Cairn, the 65 KwH Model 3 will scorch from rest to 60 mph in 4.4 seconds, will have range of 225 miles and take one hour for a fast recharge. Tesla is expected to claim 100,000 orders for the Model 3 before it’s even launched, but given the $1,000 deposit is refundable and production won’t be able to get close to that number for a while, that doesn’t really mean much. Cairn expects Tesla to ship 196,890 Model 3s by 2020, about 100,000 short of Tesla’s official guidance. Morgan Stanley expects the first upmarket versions of Model 3 to be priced at more than $60,000. Morgan Stanley says total Tesla vehicle production will only reach just under 249,000 by 2020, compared with the company forecast of 500,000. The Model 3 is likely to be at least as handsome as its siblings, the Model S and Model X, but it doesn’t really matter how it looks; the technology is all. You can see from the gallery that none of the competitive battery-only cars have benefited from much attention from the company stylists. Article: http://www.forbes.com/sites/neilwinton/2016/03/31/teslas-model-3-will-join-small-group-of-pioneering-battery-powered-cars/#3e417ff59e88 |
James Ramos,BPII'm your go to solar energy expert here to guide you step-by-step through all of your solar options. Categories |
James The Solar Energy Expert





 RSS Feed
