|
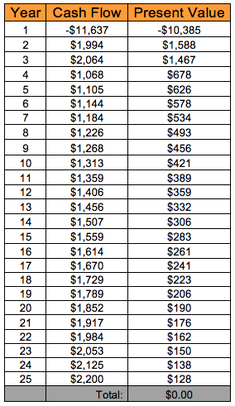
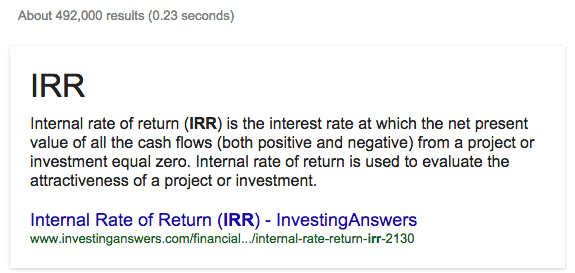
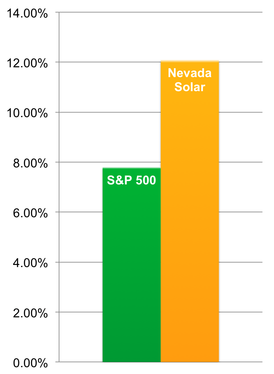
It may sound daunting at first, but understanding the financial return of investing in solar can greatly simplify the decision-making process. SOLAR POWER ROCKS — An internal rate of return, also called an economic rate of return (ERR) or discounted cash flow rate of return (DCFROR… seriously?), is an indicator of the yield of an investment. It’s a figure often used to measure and evaluate long-term investments. As a result, the internal rate of return makes comparing potential investments of equal lifespan relatively easy. But how does it achieve this? Let’s break down the complicated definition you’ll find on Google. I’m going to be honest, I’ve read it three times and I still don’t know what it’s saying – except for that last line. Let’s start there. The IRR is used to evaluate the attractiveness of a project by quantifying the long-term profitability, making it easy to compare to other potential investments. Generally speaking, the greater a project’s internal rate of return, the more desirable the project. To put this figure into perspective, the S&P 500 has an average IRR of 7.81% over the past twenty years. However, you might be surprised to find that solar policies have enabled solar returns to consistently outpace this rate, such as in the example later in this post. Solar IRRs are also more stable than that of market indices, due to the predictability of the sun coming up everyday, increasing electricity prices, and equipment performance.  Solar stomping the S&P 500’s IRR Anyway, onto the hard part. By adding up the present values of all the annual cash flows and setting this sum, the net present value, equal to zero, the internal rate of return is revealed. The equation for present value looks pretty intimidating: The present value of each annual cash flow entry can be calculated using this equation, then added together to produce the net present value, which will come out to zero if the correct IRR has been used. This calculation is annoyingly complicated by the fact that present values are calculated using this same rate value, making the process of solving for the IRR an iterative one. Let’s look at an example to better understand what any of this means. Example Internal Rate of Return Calculation for an Average (5kW) Solar System Where better to start than sunny Nevada? Below is a table based on the numbers you’ll find on the Nevada Solar Page example. The table shows an example cash flow for the purchase and return on a 5kW solar system over 25 years. For each cash flow entry, there is a present value, calculated using an IRR of about 12.1%. By adding up the present values, a total of zero is produced, indicating that this is an accurate IRR figure for the solar project.  Fortunately, tools like Microsoft Excel’s IRR formula exist to do the grunt work for us, otherwise determining the IRR to be 12.1% would have been a tedious process. While spreadsheets can easily calculate the internal rate of return, they fail to express the meaning of the IRR and the risks associated with these projects. Not that smart are ya now, computer?
Interpreting the Internal Rate of Return As you may have picked up on by now, the IRR draws its significance through comparisons, and the most fundamental comparison to be made is between a project’s IRR and the investor’s cost of capital. I think we’ve learned enough for one blog post, so let’s just skip to the layman’s definition of cost of capital: it is the minimum return that you can expect from your investments, setting a benchmark for alternative projects to meet. So an investment whose IRR exceeds its cost of capital is economically profitable! One of the largest factors in determining the payback period of a solar system is the cost of future electricity. Being unable to predict the future, anticipated rate increases vary from 1.5% up to 6% annually. However, conservative estimates can be made based upon historical rate increases, diminishing the risk associated with this key assumption. Further consideration must be paid to the predictions associated with incentive payments and equipment performance. While some incentives are hopefully here to stay, such as the almighty 30% federal tax credit, the state of Solar Renewable Energy Credits (SRECs) and other performance-based incentives have a murky future and pose a risk that should be taken into account when crunching the numbers on solar. Ending on a good note, equipment performance and maintenance pose a very low risk due to the high predictability of array performance and the rugged nature of modern solar panels. Conclusion Comparing potential investments is made easier by taking a peek at the projects’ respective IRRs. When considering whether to get solar, it’s important to look at the internal rate of return associated with your quote and compare this number to other potential investments over the same time period. The best way to learn more about your roof’s solar potential is to get in touch with a solar advisor.
0 Comments
Leave a Reply. |
James Ramos,BPII'm your go to solar energy expert here to guide you step-by-step through all of your solar options. Categories |
James The Solar Energy Expert


 RSS Feed
